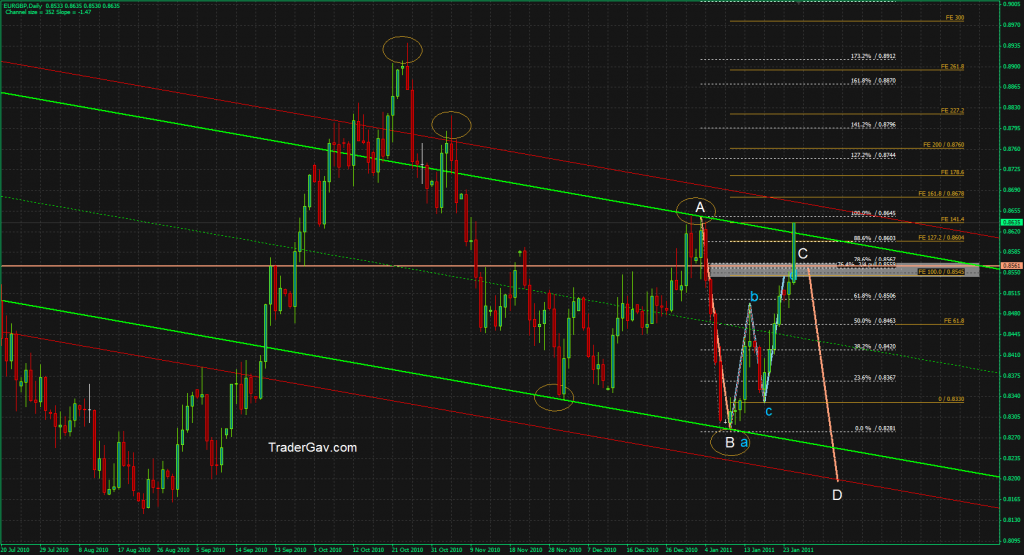
I have been looking at this chart since last Friday. Starting from 0.8540 will trigger my short. However, there’s also a possibility of running into 86 level where another bearish harmonic setup is formed. In short, currently, I am looking at the zone that contains confluence of bearish harmonic pattern, Fib levels and price resistance level.
Let’s see how it goes.
[tab: Original Setup 24 Jan 2011]
Here is the….CHART!

[tab: Update 25 Jan 2011]
After the weaker than expected British GDP data, EURGBP pierced through the reversal zone. The setup is now invalidated/failed/whatever you wanna call. Time to move on, and look for next opportunity.
Here is the updated… CHART!


Nice chart, actually I was thinking in shorting EURGBP based on oscillators with far less ambititious targets, but will try to see with a trailing stop if the pair goes that down! Thanks for the info 🙂