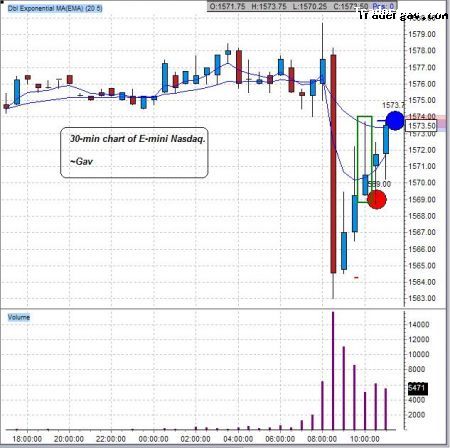
Though I did read the cautious words from Mike’s blog about options expiration, I decided to trade if any dummy set up was found. Short position of E-mini Nasdaq was established below 10am (chicago time) candle. It took 1 hour to stop me out. Darn! However, everything was done by following my rules.
One trade closed with 1-R loss.
[photopress:Nasdaq_30min_trade_close.JPG,full,centered]
Technorati Tags: E-mini, Nasdaq, trading journal
powered by performancing firefox


Gav,
Please elaborate a little. It looks like the bottom of the 10AM bar was around 1569.25. Did the next bar break below it and trigger your short at 1569? The red dot on the chart obscures that area.
Thanks!
Gav,
Please elaborate a little. It looks like the bottom of the 10AM bar was around 1569.25. Did the next bar break below it and trigger your short at 1569? The red dot on the chart obscures that area.
Thanks!
Will: The low of 10am candle was 1569.25, and the next candle (1030am) hit a low of 1569. That’s where my short order was triggered. The red dot on the chart was the point that my sell order get triggered.
Have a good day 🙂
Will: The low of 10am candle was 1569.25, and the next candle (1030am) hit a low of 1569. That’s where my short order was triggered. The red dot on the chart was the point that my sell order get triggered.
Have a good day 🙂