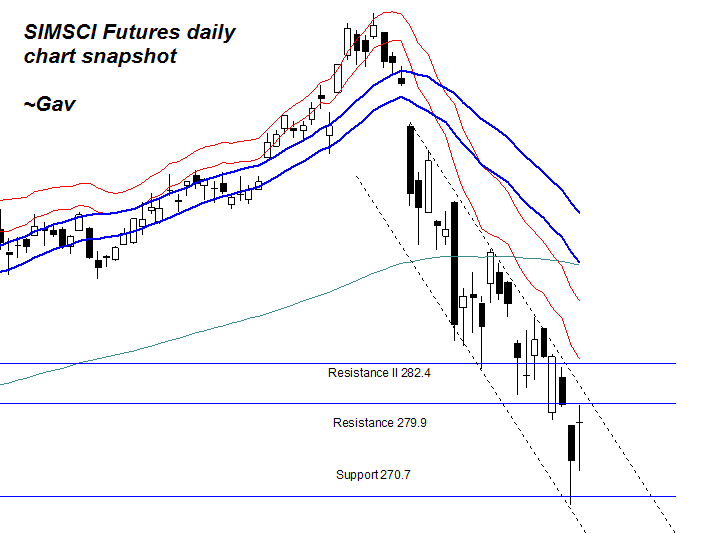
 Before a new week get started, it is necessary to have a view of Futures market movement retrospectively. It is beautiful, I would say. A downtrend channel has not been violated at all since it was formed weeks ago. From daily chart, short term time frame, I would say, ‘Downtrend is still intact’. There was a small rebound at the end of last week. I am not optimistic about this jump. Very interesting to know that, DJ sank into negative territory last friday, again. Yes, again. I am looking at area between 280 and 282.4 as resistance zone while immediate support level is around 270.7. This is to provide me a bigger picture during day trading.
Here is what my chart eyes see
Directional analysis:
Downtrend intact, possibility of some rebounds exists as it reaches extreme area.
Sentiment analysis:
Remain Negative. Bearish for the time being.


Leave a Reply