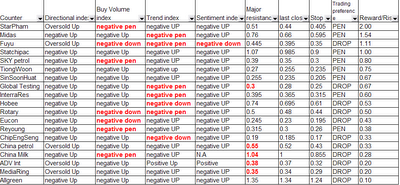
This opportunist series is to capture stocks which experience extreme bearish sentiment and starts rally. Tight stop loss is implemented as broad market sentiment and trend remains bearish. I have found some counters for agressive trading style to capitalise in the rebound rally in the existing downtrend. Almost all of the stocks I have found […]
Old blog archive
Chart Eye: Sesdaq daily trend : ended 16-June-2006
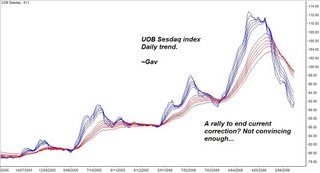
So we have seen a strong rally last Friday. It was expected to hear some voices in forums discussing ‘Bull is back to action’. Well, I have decided again to do some analysis on the trend. And this time, I want do something interesting. Firstly, I am looking at daily trend of UOB Sesdaq index. […]
Swing Trade for 16-June-2006: No candidate
Given yesterday’s positive closing of STI and recent rally of U.S indices, I did a scan on my stock list for potential swing trade candidate. Few china counters appeared in rally with volume scan. However, none of them passed the directional and trend test for the time being and most of them are actually trading […]
Chart Eye: STI daily chart : Ended 09-June-2006

This is trend analysis of daily chart of STI. Downtrend is still intact, though there was rebound at the end of last week, that did not help much in term of trend change. There is no sign of recovery. Directional analysis wise, there was a slight up turn in directional element, however, it is still […]
Chart Eye: Sesdaq daily chart : Ended 09-June-2006

This is daily chart of Sesdaq. Nothing much has changed. There is no sign of recovery for small cap. Directional analysis shows a continuation of downward movement. Negative sentiment is still hanging in the air for now. Trend characteristics analysis shows intact downtrend with no sign of reversal. I am not interested in any stocks […]
Chart Eye: SIMSCI daily chart Snapshot: Ended 09-June-2006
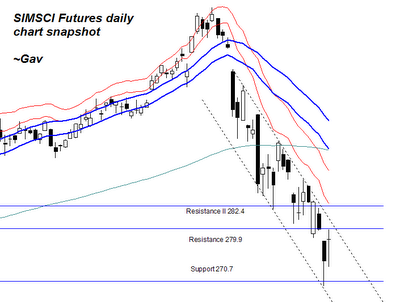
Before a new week get started, it is necessary to have a view of Futures market movement retrospectively. It is beautiful, I would say. A downtrend channel has not been violated at all since it was formed weeks ago. From daily chart, short term time frame, I would say, ‘Downtrend is still intact’. There was […]

