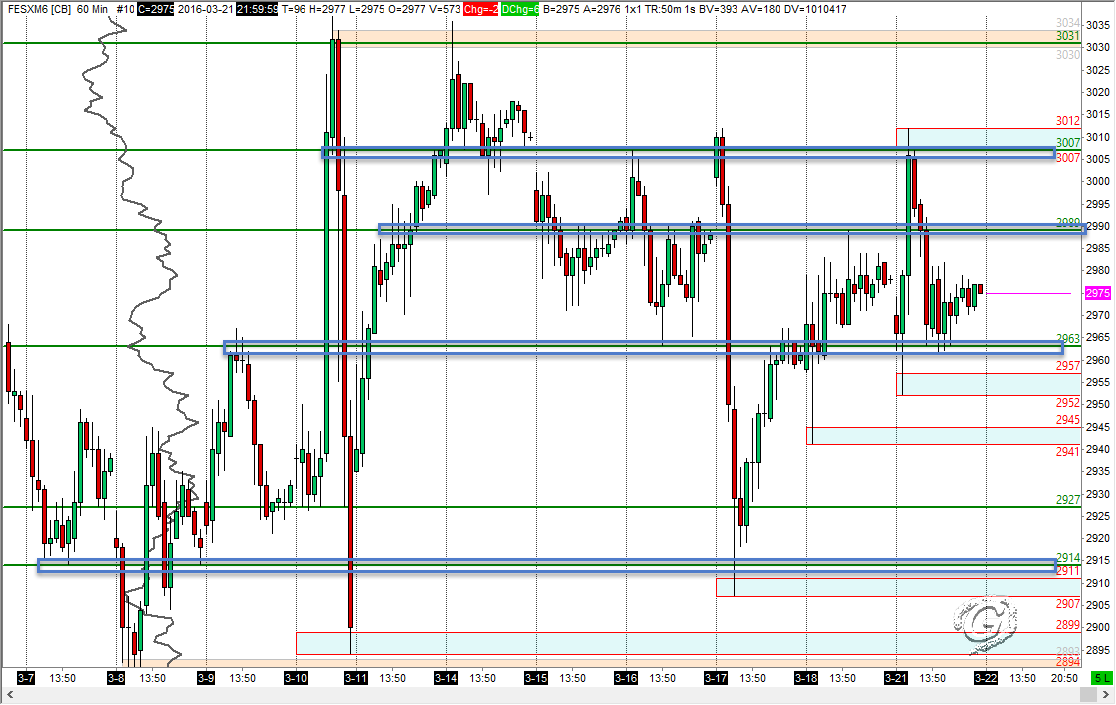
Here are the levels I am looking at for today’s session. Time constraint, I will start with FESX for now, and with limited description. Charts prepared using Sierra Chart.
Trading Journal
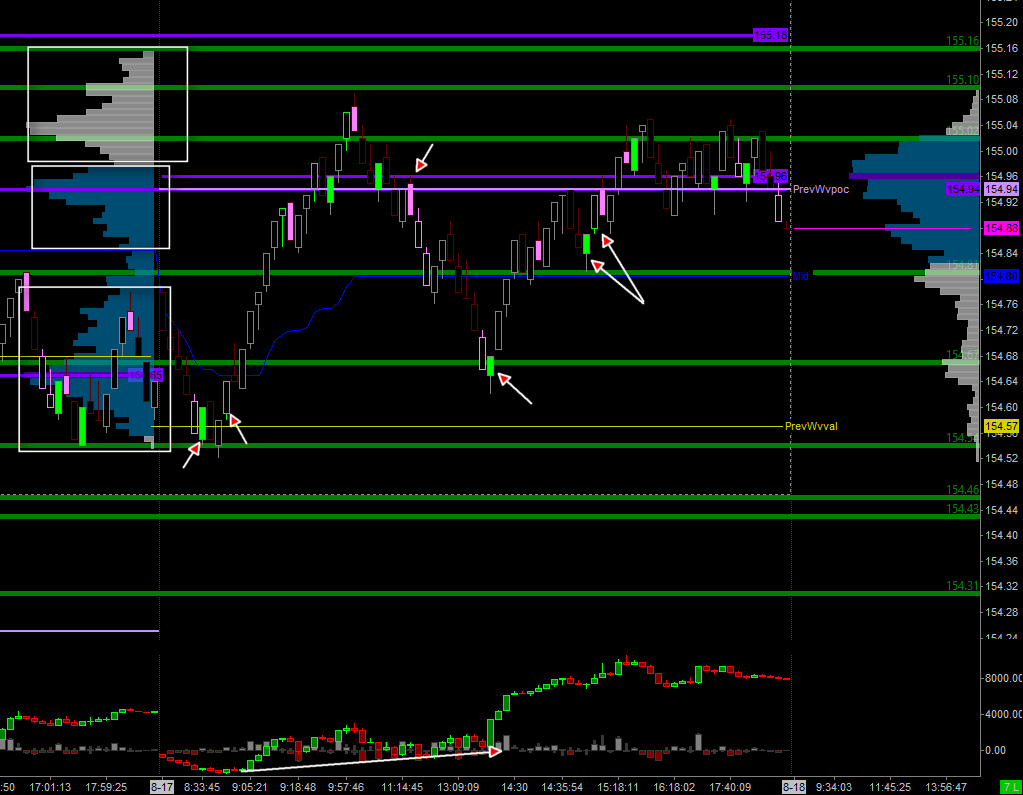
$AUDUSD recap 17 November 2015
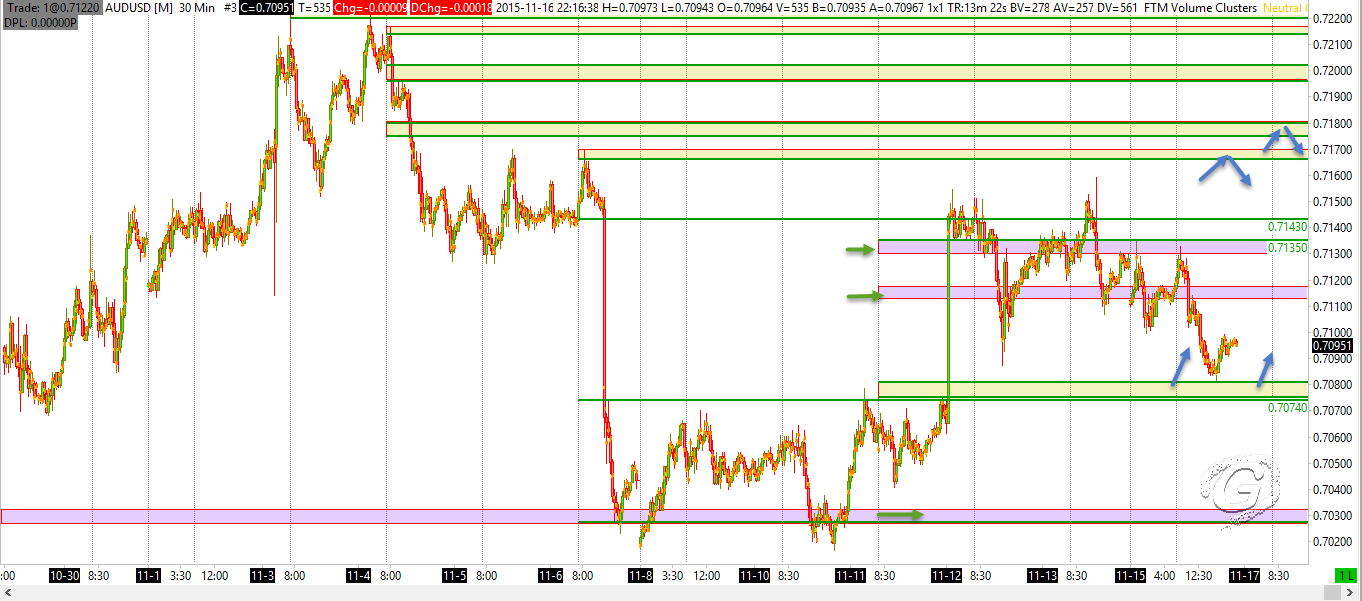
Yesterday, I tweeted about $AUDUSD ‘s structure prepare. Here is the updated chart. I expected market to fill the single prints between 7074 and 7143. $AUDUSD looking at the potential of repairing the structure between 7074/7143 — Gavin (@tradergav) Nov. 16 at 11:13 AM Updated chart Looking ahead, here are some zones I am […]
NQ Futures EOD review 04 Nov 2015
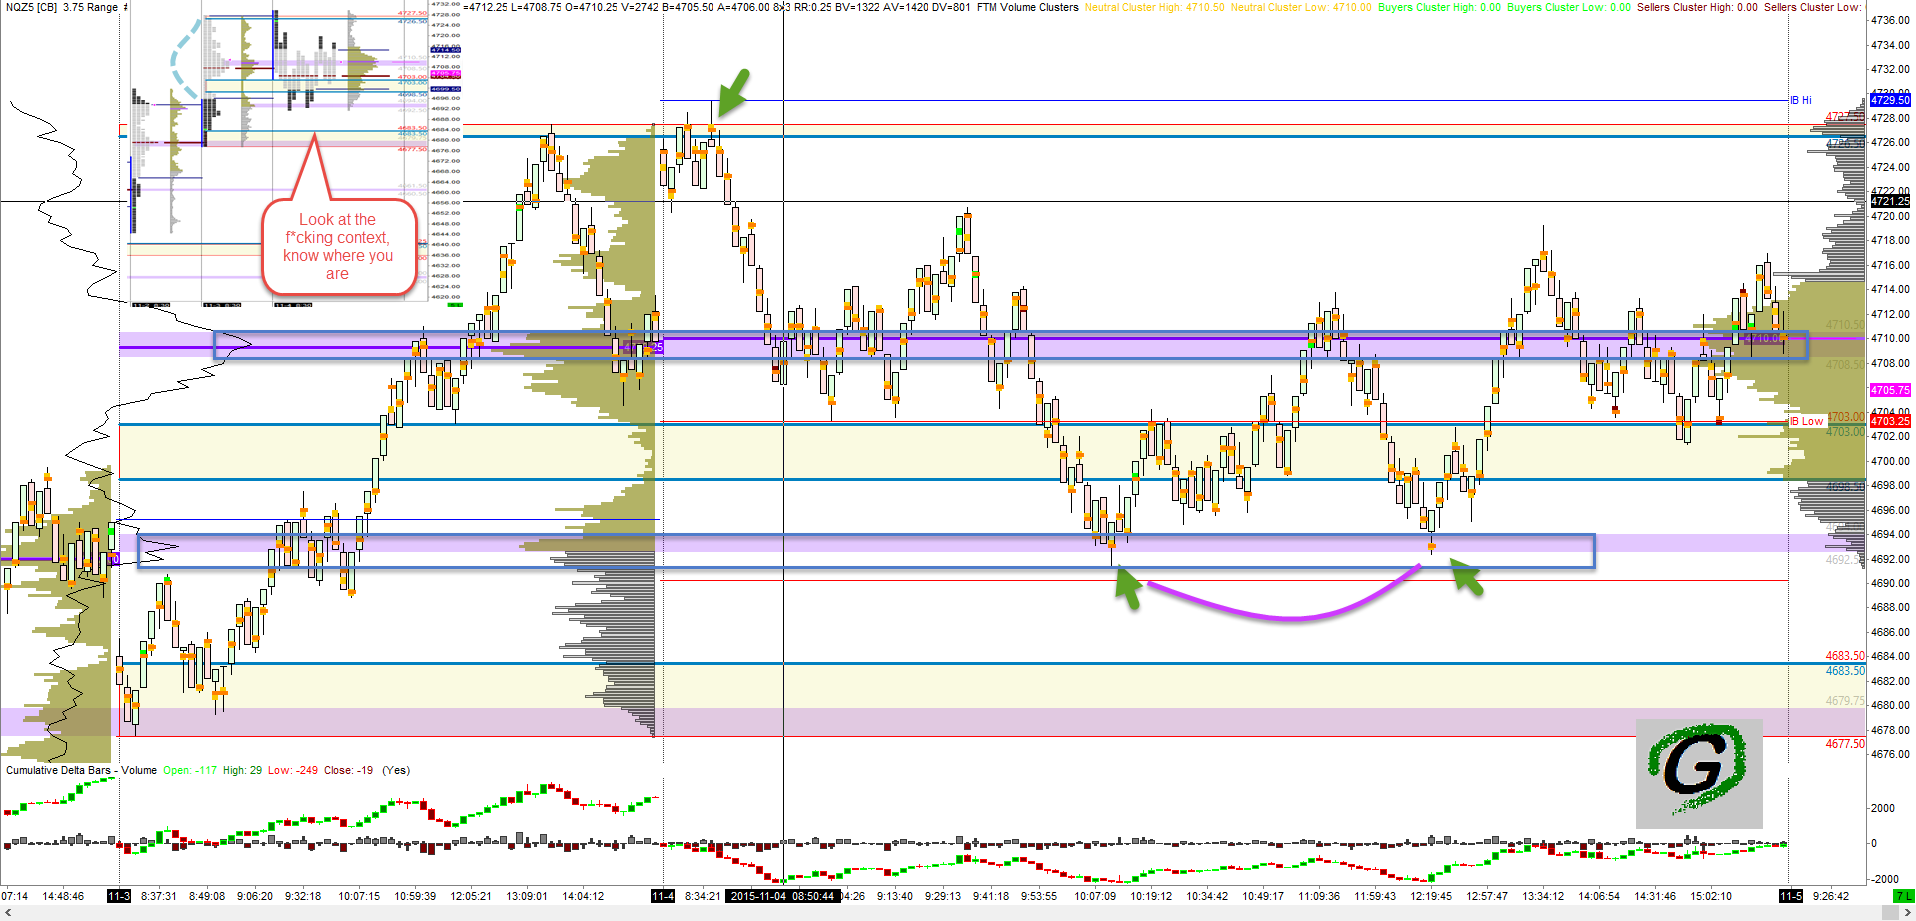
RTH opened with a false break of yesterday’s high (4727.5 vs 4729.5), and auctioned past yesterday’s point of control and to the lower balance zone (HVN). This is contextual review, which is very important practice (at least for myself) to identify trade location. Actually entries relied on the skill of volume and order flow analysis, […]
NQ Futures EOD review 03 Nov 2015
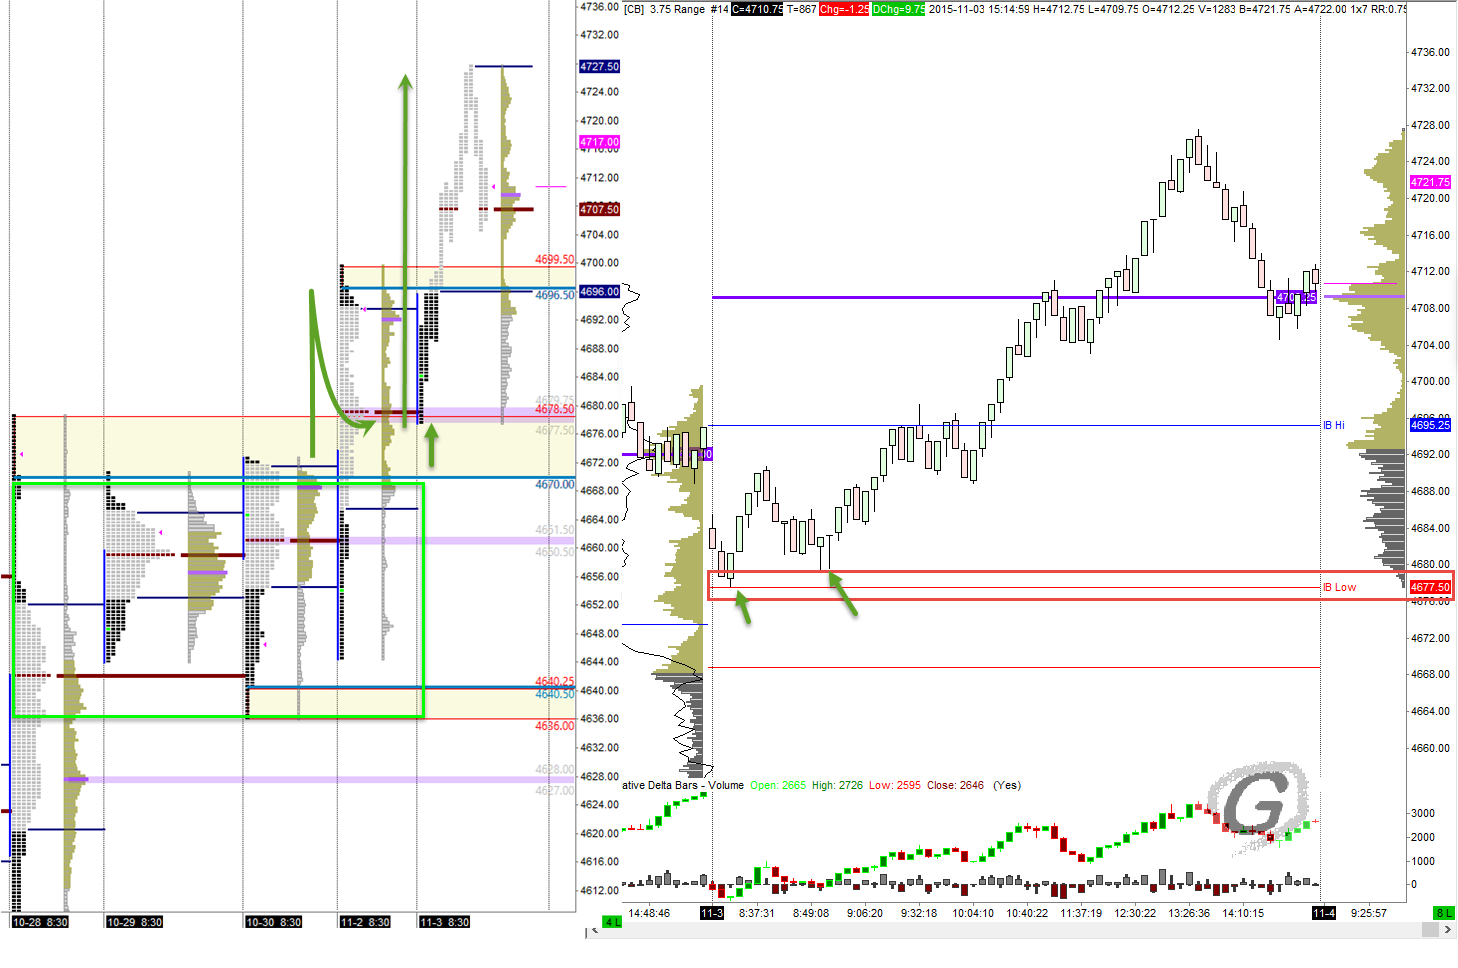
NQ Futures broke out from bracket on Monday. It retested the previous daily swing high 4676.5 and rejected at the Monday’s VPOC today gave me a hint that the breakout was for real (at least for day trading purposes), and market was trying to discover higher price levels.
STOXX 50 FESX review 02 Nov 2015
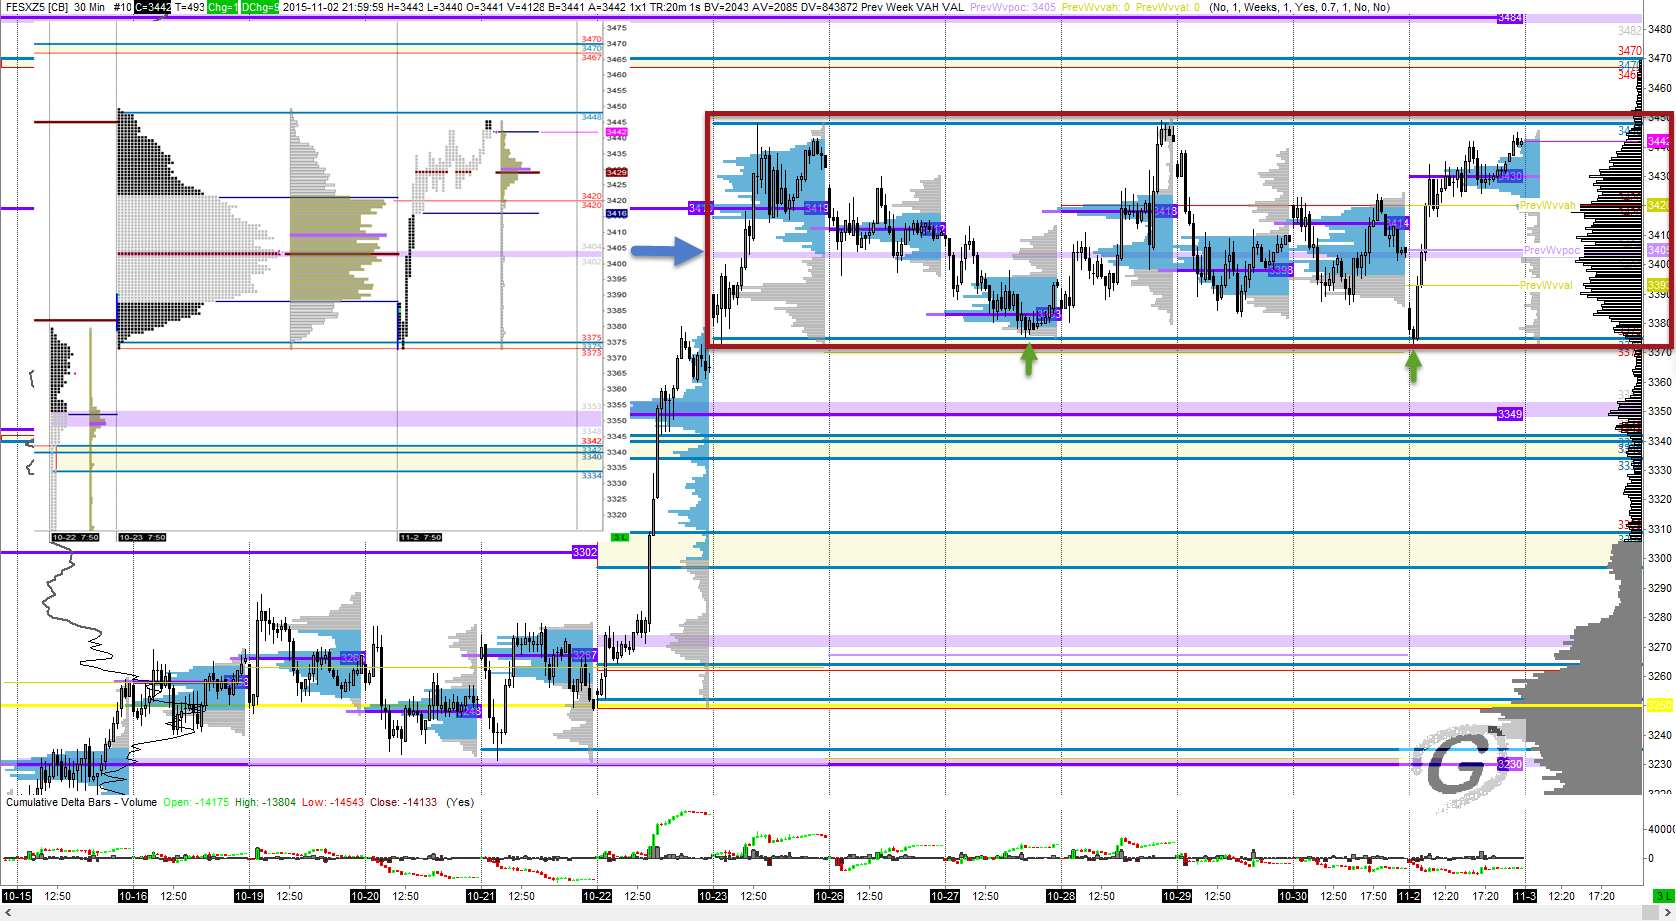
It has been a long time since my last blog post. I have been trading. I thought I will write a quick review of FESX (DJ Euro STOXX 50 futures) since it is one of the product I frequently trade, and observe some interesting development now. We are in a 7-day bracket (i.e Price rotates up […]
BUND EOD review 17 Aug 2015
I am a fan of creating my own trading tools. Yes, it is time consuming, but it helps to reaffirm my understanding of my own trading methodology during the design and development,and the end product helps to reduce some of my repetitive daily tasks during the trading day. No, I am not talking about automation […]

