• Skip to primary navigation
  • Skip to main content
  • Skip to primary sidebar
  • Skip to footer

TraderGav.com

Gav's trading blog - Perseverance, Consistency, Confidence

  • Home
  • Start Here
    • Back to Basics of Trading
    • Resource For Traders – The Best Tools for Traders
    • Learn Trading Articles
    • Sierra Chart Resource
  • Blog
    • Blog Posts
    • Other learning resource
    • Dummy Collection
    • Harmonic setups
  • About Me

Trading Journal

Review week ended 05-Jan-2007

by Gav Leave a Comment

Before I go?out to catch the movie Curse of the golden flower,?here is?the review of?this week’s result.

It was a short week due to holidays. I only made two trades, with one break even and one winner. Result should have?been better. I failed to pull the trigger on Wednesday which I ended up watching market running without me. Ah well….

  • Total?P/L: 1.83 R
  • Trades Taken: 2
  • Winners: 1 (50%)
  • Expectancy: 0.915 R
  • Biggest Winner: 1.83 R
  • Biggest Loser: 0 R

Filed Under: Trading Journal

Dummy day trading #41 05-Jan-2007: NQ Short trade closed

by Gav Leave a Comment

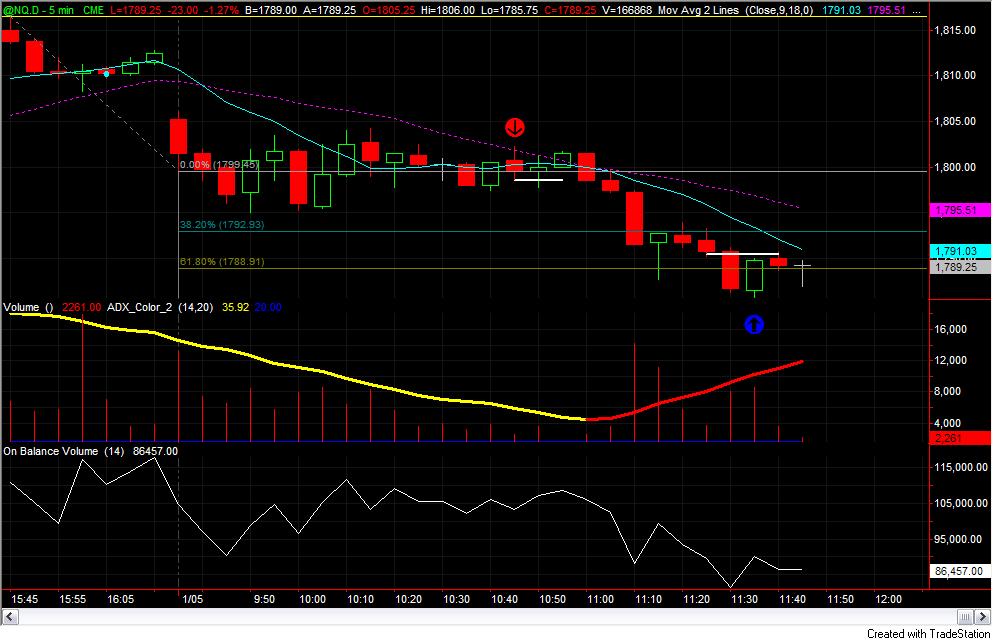
Short position of NQ was established when NQ first pulled back to 18 MA. Stop was moved to break even point after 1.5-R gain. Subsequently, I trailed stop twice to protect profit. Position was closed with 1.83-R gain.
Trade summary

  • Short below low of 15th (10:20am) candle @1798.25 which was the first pull back of current trend cycle.
  • Initial stop loss was set at the high of 15th candle.
  • Position was closed right above Fib extension level 61.8% @1790.25

One trade closed with 1.83-R gain.

05 Jan 2007
05 Jan 2007

Filed Under: Dummy Collection, Trading Journal Tagged With: Dummy Trading E-mini Nasdaq, Trading Journal

Dummy day trading #40 04-Jan-2007: NQ Long trade closed

by Gav 2 Comments

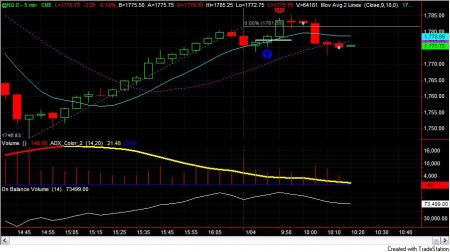
Long position of NQ was established above 935am candle which is right above upward trending 9-MA. Stop loss was moved to break even point after 1.5-R gain. Well, I got stop out with 0-R gain.
Trade summary

  • Long above second bar high which was the first pull back of current trend cycle
  • Initial stop loss is set at the low of second bar.
  • Stop loss was moved to break even point after position was in 1.5-R gain.
[photopress:NQ5minLongtradeClosed.jpg,full,pp_image]

Filed Under: Dummy Collection, Trading Journal Tagged With: Dummy Trading E-mini Nasdaq, Trading Journal

The stupid paper trader; Trade that got away 03-Jan-2007

by Gav Leave a Comment

Yes, the stupid paper trader, that’s me. The difference between real trading and paper trading is I will never fail pulling the trigger when paper trade.

This is the second time of the day. I failed to pull trigger in the morning (Singapore time) when trying to swing trade stock. What on the earth am I doing today?
Today, the first trading day of 2007, and heck, I just can’t pull the trigger!?!. Yes, I am frustrated , and disappointed of myself. This is unacceptable.

I continued following the trade,well, on paper :(? . The trade would close with 3.5-R profit.

5-min chart of NQ. Entry is the first pull back of new trend cycle. And dummy spot, inside bar, was formed. Long position would be established above the high of the 10:05am candle. I trailed my stops and position would close at 1809.75.

[photopress:NQ5mingotawaytrade.jpg,full,pp_image]

Filed Under: Trading Journal Tagged With: Trading Psychology

Trades that got away 20-December-2006: NQ Long

by Gav Leave a Comment

I continue my paper trading today. Long position of NQ was established above 950am candle. Trend chart was up, only long position was considered. Trend chart is referring to my trend evaluation system which is built in longer time frame.

Minimum target was set at Yesterday’s high 1814.5. It was hit. I moved the initial stop loss to break even level. NQ failed to continue moving up. I exited the position at the open of 1025am candle when the previous candle (1020am) closed below moving average, and it was also the forth candle which failed to exceed last swing high.
One trade closed with 0-R gain.

[photopress:NQ5mingotaway.jpg,full,pp_image]

Filed Under: Trading Journal

Trend Evaluation system : Update of my work

by Gav Leave a Comment

Back testing is tough, back testing is boring. Back testing is #$%^&. No doubt. But while I was looking back charts, programming codes, ideas and thought flowing into my mind.

I was having some thoughts over the process of developing my trading system. At the earlier days when I first started Dummy trading, I simply jumped into a trade as long as a valid dummy spot appeared. I can’t say that was right or wrong. But by trading this way, it reduced the expectancy and accuracy of my system (well, I thought I did have a system! lol). When you have a system with positive expectancy, chances are you will be profitable in the long term. But when you have a system with low accuracy, you will have a tough time fighting with yourself to handle the strings after strings of losses (even though they were just small losses!). I had a discussion with Dave on this topic recently as well.

I decide to have a look at the core element of dummy trading. TREND. Yup, basically, I am looking to buy pull back or consolidation within an established trend. During the choppy day, I will be bleeding. I will be better off if I can analyze the current trend before I establish a position. Again, I can spend the whole day drawing lines, calculating moving averages, but day trading requires fast and accurate decisions, so , it will be helpful to have something built to reduce number of decisions I need to make during trading session.

I have drafted out a high-level chart to illustrated my work now.

[photopress:trendevaluation_1.jpg,full,pp_image]

My task now is developing a Trend Evaluations system. Of course, by no mean, this is a holy grail. It might be just a Moving Average crossover system, drawing some lines or just an ADX calculation system etc. No rocket science. It just to assist me to understand and see the TREND in a faster, and handy way. I am trying to find a method that will keep me at the right side of the market, (well, of course, it can’t be 100% accurate, at least, it put me at the high probability side of trade) regardless of what other system rules (such as Dummy) I might be following. So the end result will be, I have a “system” that takes a position as soon as I find a trend and then exits when the trend is over.

The reason is, if I start from a basis where I am already on the right side of the market, then whatever entry and exit rules I superimpose on my calculation of trend SHOULD only continue to improve my results.

Well, work is still in progress. Just to share something that I am currently doing, and I hope it helps me to grow as a better trader.

Filed Under: Trading Journal Tagged With: Strategy & tools

  • « Go to Previous Page
  • Page 1
  • Interim pages omitted …
  • Page 99
  • Page 100
  • Page 101
  • Page 102
  • Page 103
  • Interim pages omitted …
  • Page 124
  • Go to Next Page »

Primary Sidebar

Best Tools For Traders

Recommend FX Charting

Footer

Recommended FX Charting

Recommended Training

FXSAnalytics
Price Action Course for Professionals

Copyright © 2025 · Affiliate Disclosure · Privacy

We use cookies to ensure that we give you the best experience on our website. If you continue to use this site we will assume that you are happy with it.Ok