• Skip to primary navigation
  • Skip to main content
  • Skip to primary sidebar
  • Skip to footer

TraderGav.com

Gav's trading blog - Perseverance, Consistency, Confidence

  • Home
  • Start Here
    • Back to Basics of Trading
    • Resource For Traders – The Best Tools for Traders
    • Learn Trading Articles
    • Sierra Chart Resource
  • Blog
    • Blog Posts
    • Other learning resource
    • Dummy Collection
    • Harmonic setups
  • About Me

headline post

One USDJPY trade 12 August 2013

by Gav Leave a Comment

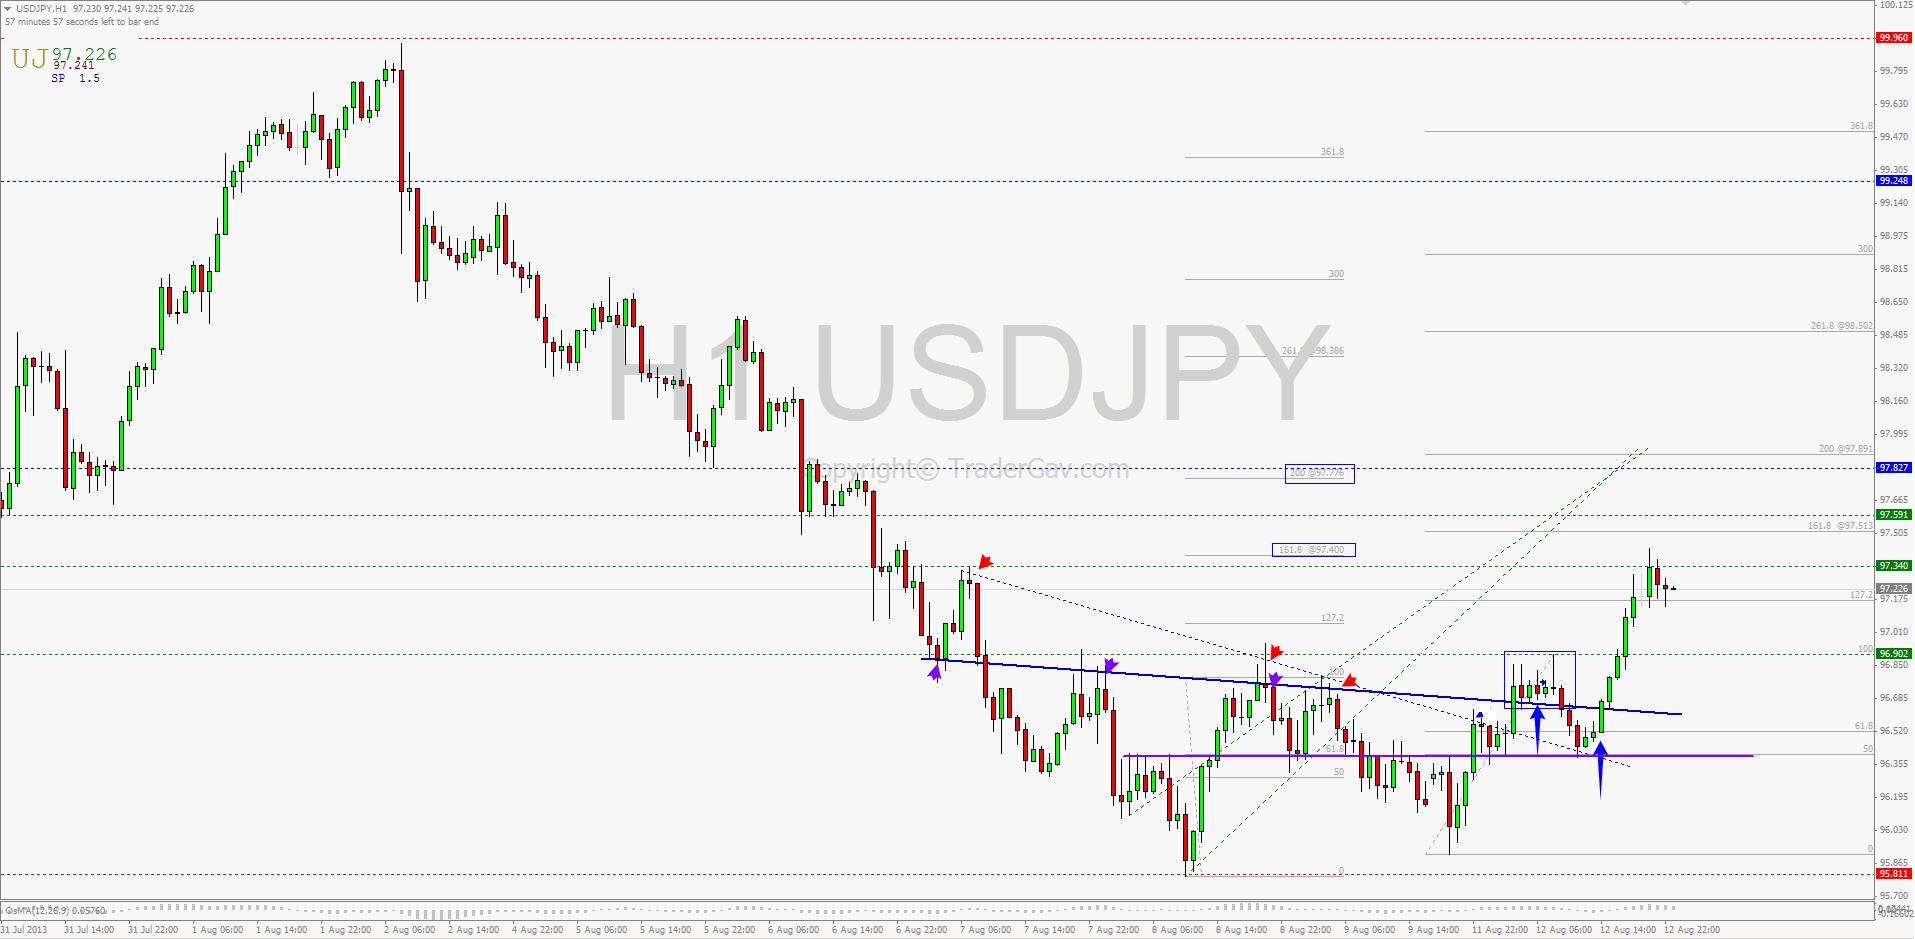
Just a quick post of one of the trades I made yesterday. I thought it might provide some educational value to my now 13 readers.

I went long of USDJPY around mid London session yesterday. My entry was not the best I would like to have.  I saw a small consolidation cluster around 96.75 , and it, in fact, broke the inner trend line. (Refer to the blue bold line in the chart below).  My view was, the consolidation above inner trend line might potentially be a launch pad for a upward movement.  Well, it dipped a couples of hours later, but never go beyond 50% retracement of the current swing. Stop loss was not triggered.

In retrospect, the dipped after my entry was indeed a retest of another broken down trend line and support level. In hindsight, this is a better entry, but hey,that’s trading, and everything looks better in hindsight, no?

Target is set at 97.40. This is the price projection measured by using the Fibonacci extension of 161.8, golden ratio, of the lowest swing low to the break of inner trend line.  The target was achieved during Tuesday Asian morning session.

2nd target is set at measured move up to around 97.80 which is also a resistance level.

Here is the 1-hour chart of USDJPY.

USDJPY 1-hour chart
USDJPY 1-hour chart

I suggest to have a look at Steve’s NBT posts for the concepts of price projections for target setting.

That’s it for now. Have a good trading week ahead!

From the desk of TraderGav.com

Filed Under: headline post, Support Resistance, Trading Journal

Weekly Review of GOLD (XAUUSD) 08 AUG 2013
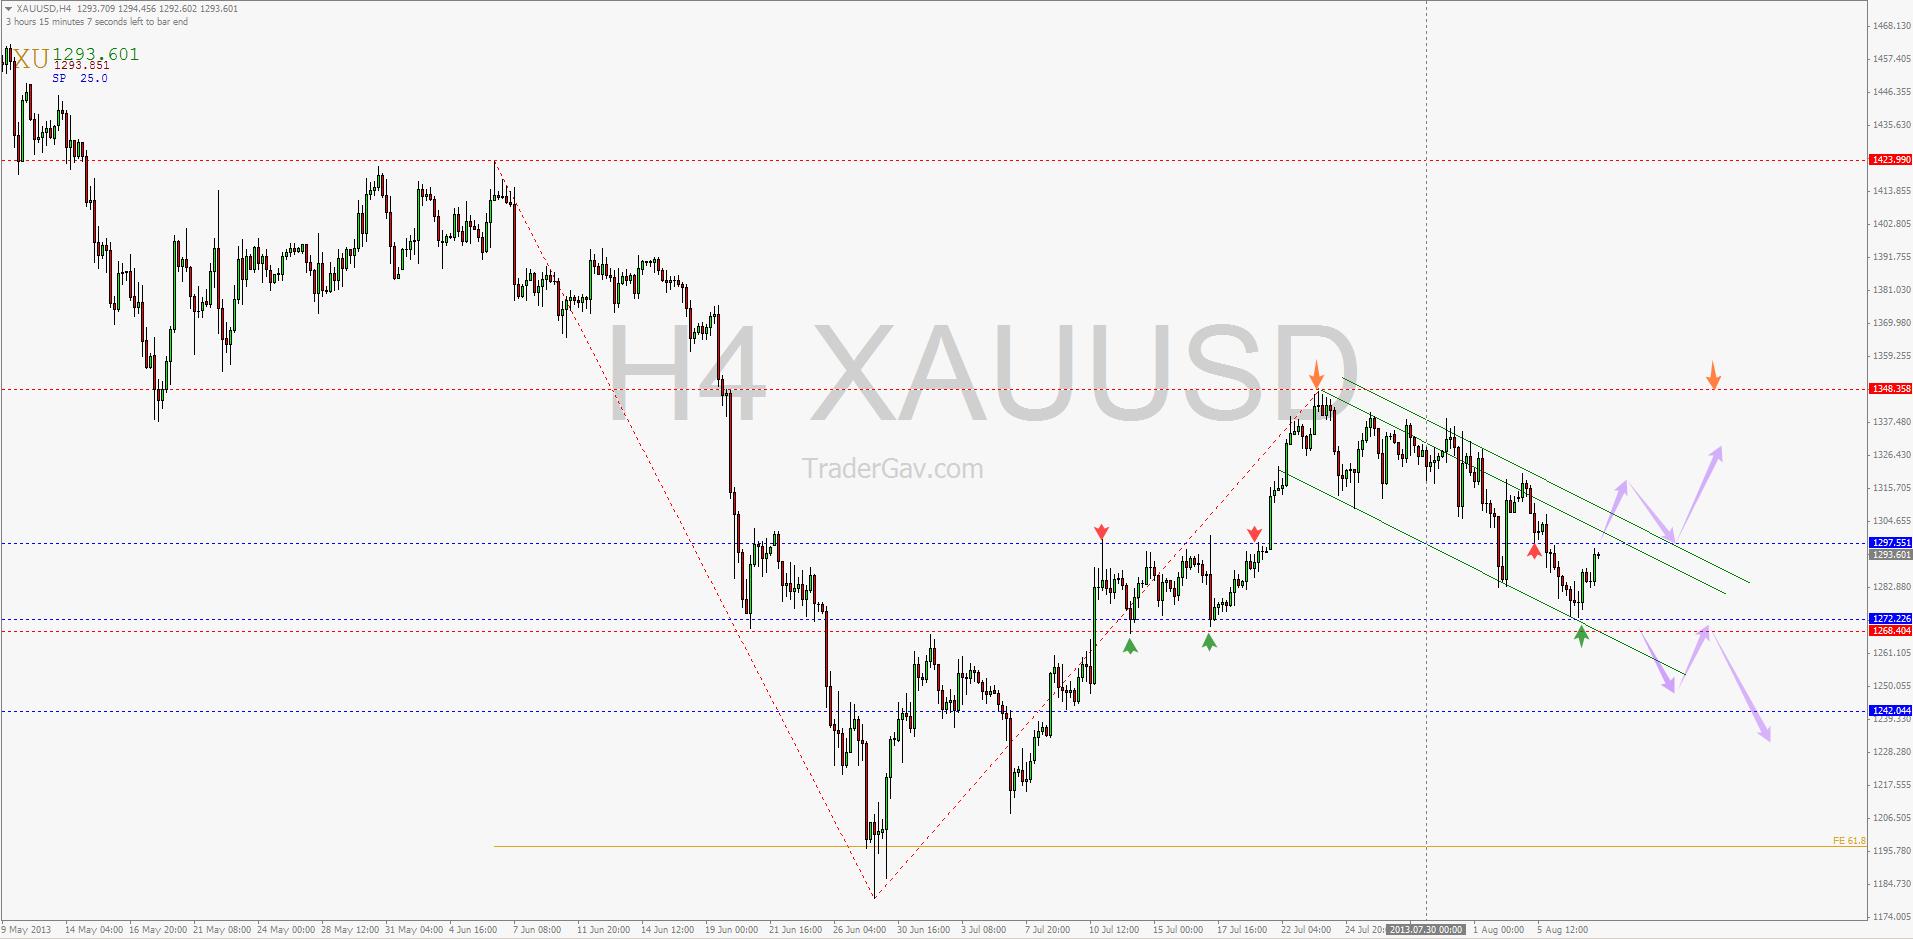
by Gav Leave a Comment

Here is the weekly review of spot GOLD XAUUSD levels. You can last week’s chart review in this post.

GOLD reacted at the resistance level and also 50% retracement of D1 down leg. 1347.57 is now the level to watch for any false break should price retrace back to this high. Overall, GOLD is contained in the Daily down channel. The key levels to watch now are 1297.55 for resistance and 1268.40/1272.22 for support.

Here is the Daily Chart of spot GOLD

GOLD Daily Chart
GOLD Daily Chart

In 4-Hour time frame,  I am watching closely is the potential break up of the H4 down channel. Refer to the 4-hour chart below, a break of this channel, and 1297.55 might bring us back to 1347.57 as mentioned before. On the hand, a break of support level 1268.40/1272.22, I will be looking at potential short setup at the pull back.

GOLD 4-Hour Chart
GOLD 4-Hour Chart

That’s all for this post.

From the desk of TraderGav.com

Filed Under: headline post, Support Resistance, Trading Journal

Weekly Review of GOLD (XAUUSD) 30 JUL 2013

by Gav Leave a Comment

GOLD XAUUSD Daily chart

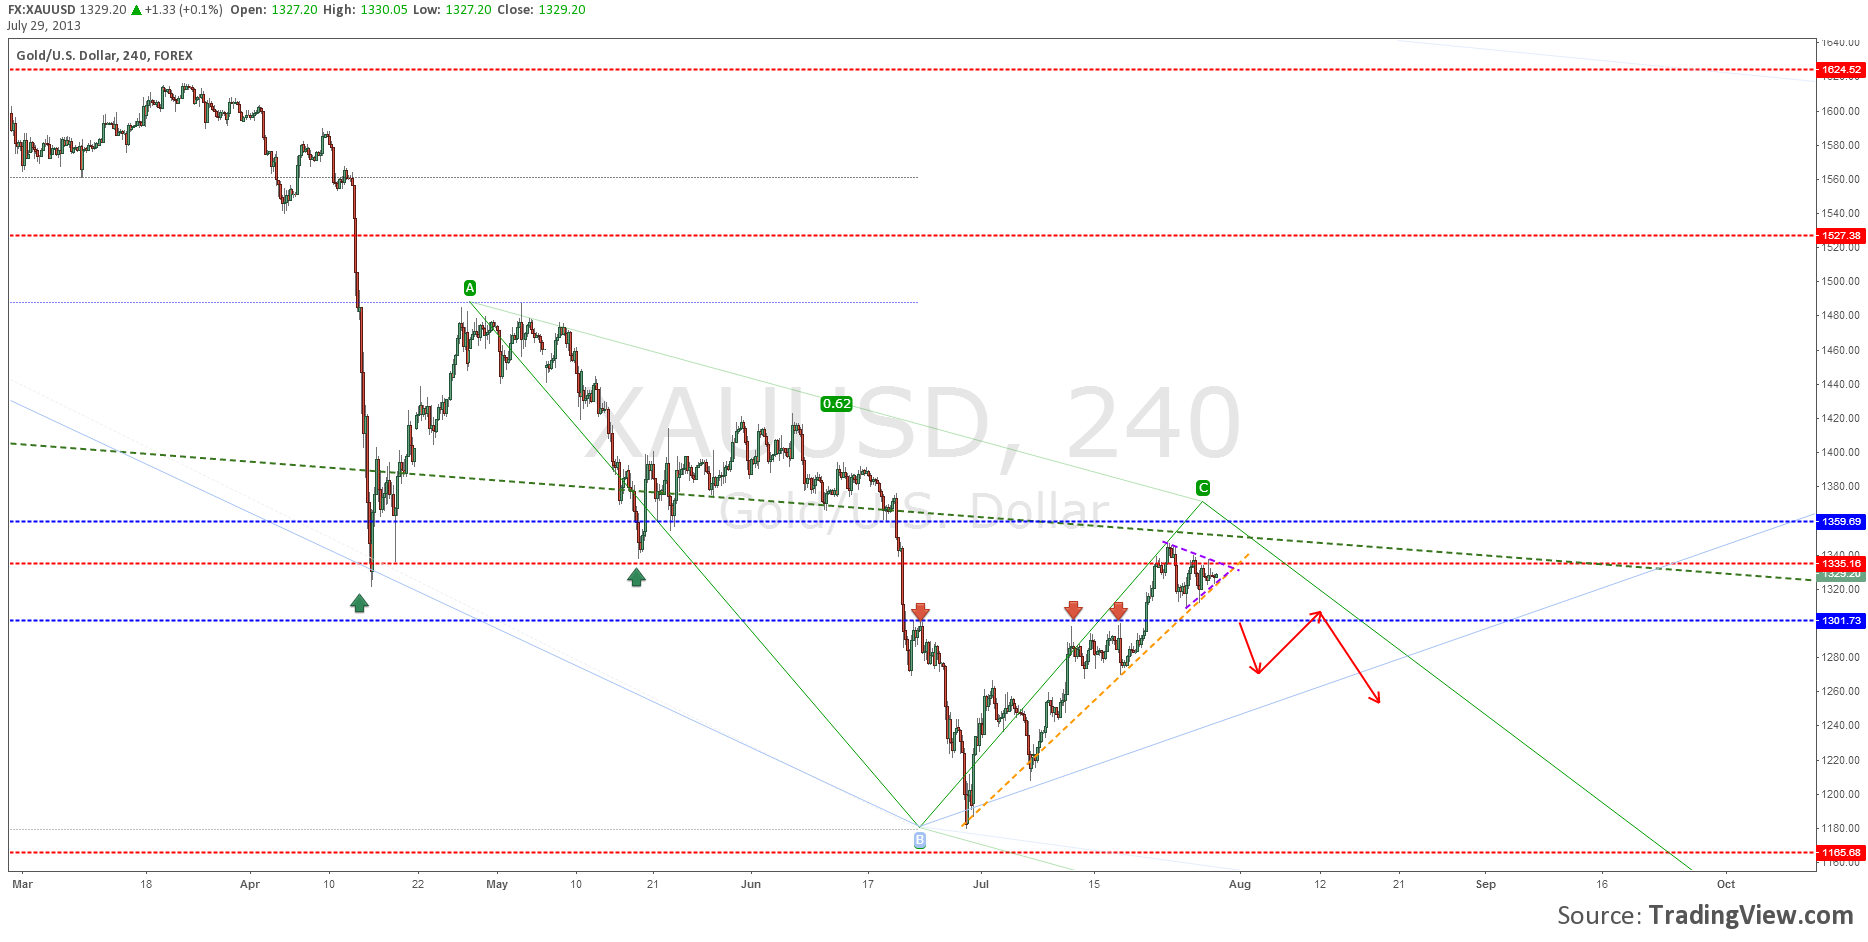
In my previous post, we have identified the potential resistance zone around 1335. We are right there now. I would like to see a turn at this area, and projected target is at 1000 should the selling resumes.
But, it is not as simple as it sounds. There are road blocks in front of us.
let’s zoom into H4. I expect to see some good support around 1300. A break of H4 uptrend line (golden line in the chart) and 1300 support should provide some ‘feel good’ factors for bears to initial shorts again.
First target for the short side is the last swing low around 1180 , and 2nd is the completion of ABCD formation at 1000. Maybe the targets are over ambitious, but who knows? That’s the plan for now.

GOLD XAUUSD 4-Hour chart

On the other hand, in case failed to ignite the selling engine, next resistance level is seen at area of 1527. Have a look at the weekly chart below. The ABCD projection is definitely hypothetical and extremely ambitious. We will review the price action later.

Gold XAUUSD Weekly chart

That’s all for now. What do you think? Let me message at the comment section.

From the desk of TraderGav.com

Filed Under: Harmonic setups, headline post, Support Resistance, Trading Journal

Waiting for the nobrainer trades AUDUSD USDJPY

by Gav

AUDUSD

Aussie remains trapped within the trading range. You can trade your range play strategies, I prefer to wait for nobrainer setups. 0.93 is still the key level to watch for any bullish movement. 0.9030 is the immediate support area to watch. A break of these levels will interest me.

AUDUSD 4-hour chart
AUDUSD 4-hour chart

For short term intraday trading, there are some levels to watch within the range. 0.9230 is the support level I watching. As a personal preference, I like to trade the reversed level, in other words, I prefer the break of support and initiate a short position at the pull back.
The next immediate support is seen at 0.9170 ish, and 0.9110.

Here is the hourly chart of AUDUSD with key levels marked.

AUDUSD 1-Hour chart
AUDUSD 1-Hour chart
USDJPY

The false break at the 98.25 level as mentioned in my previous post did not happen. USDJPY did not manage to close above the level. Instead we are likely to head to 97 now.

Here is the H4 chart of USDJPY with key levels marked.

USDJPY 4-hour chart
USDJPY 4-hour chart

And here is the H1 chart of USDJPY

USDJPY 1-hour chart
USDJPY 1-hour chart

That’s all for now. More later. Remember, it is NFP week, so keep trading if you want, and be cautious.

Filed Under: headline post, Support Resistance, Trading Journal

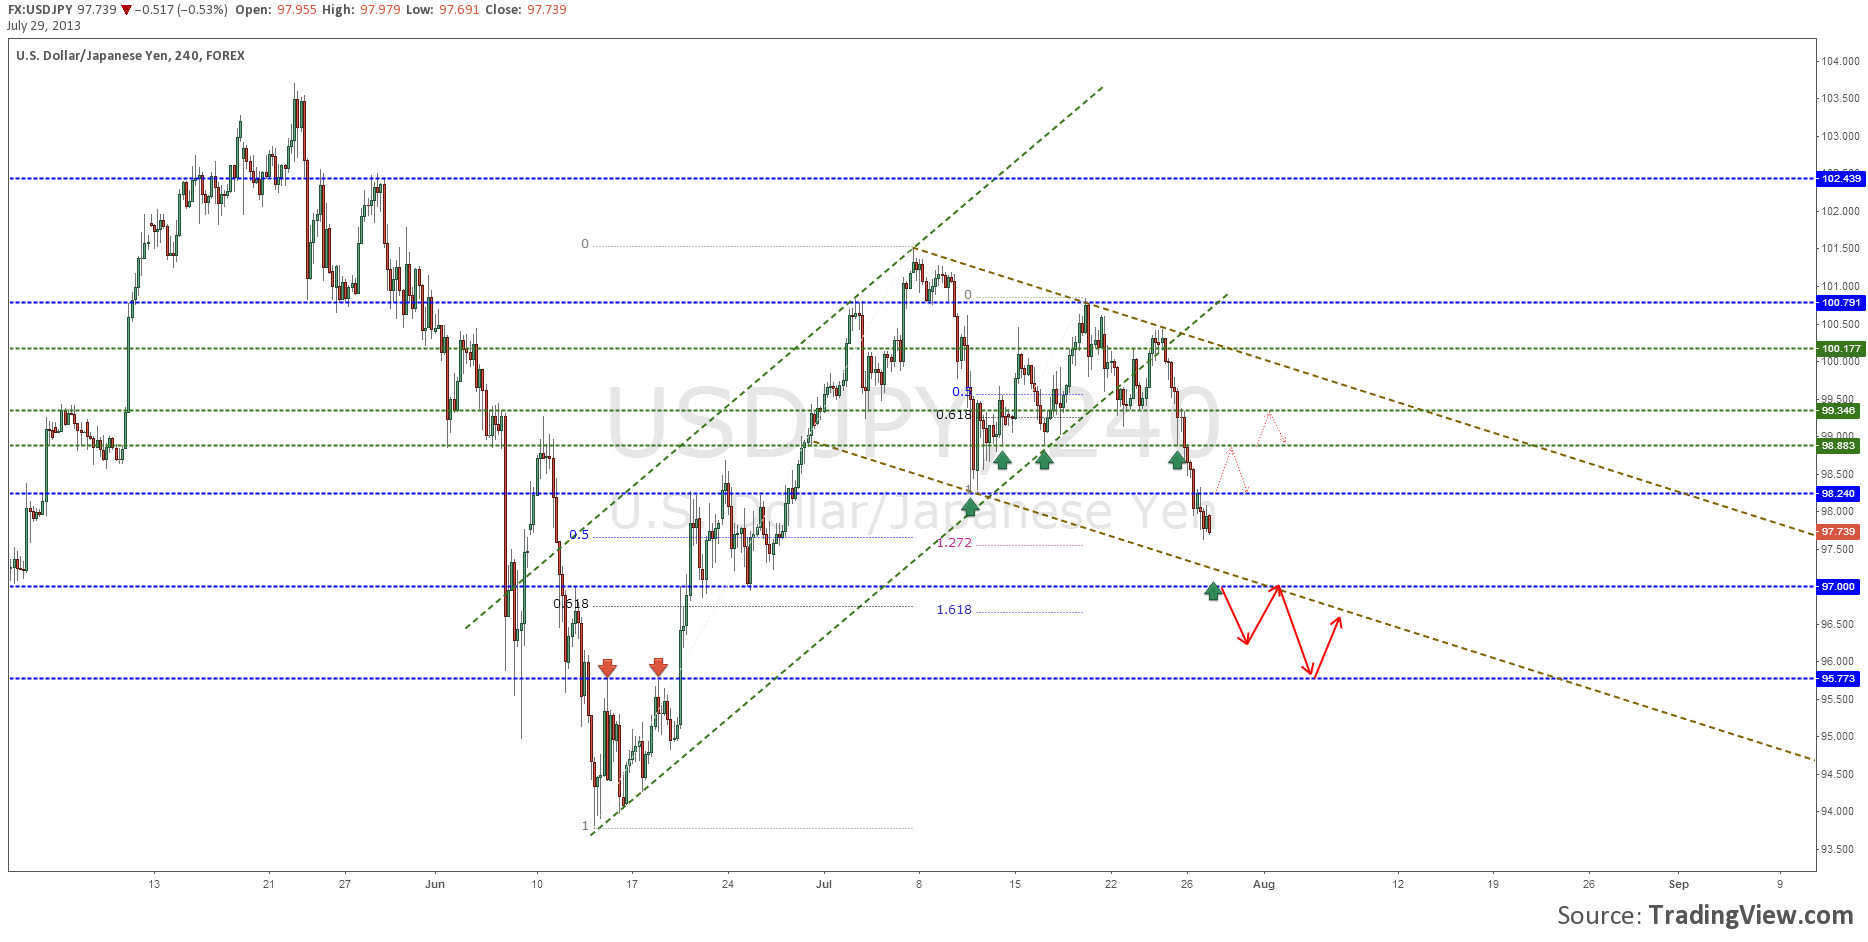
USDJPY level to watch 26 Jul 2013

by Gav Leave a Comment

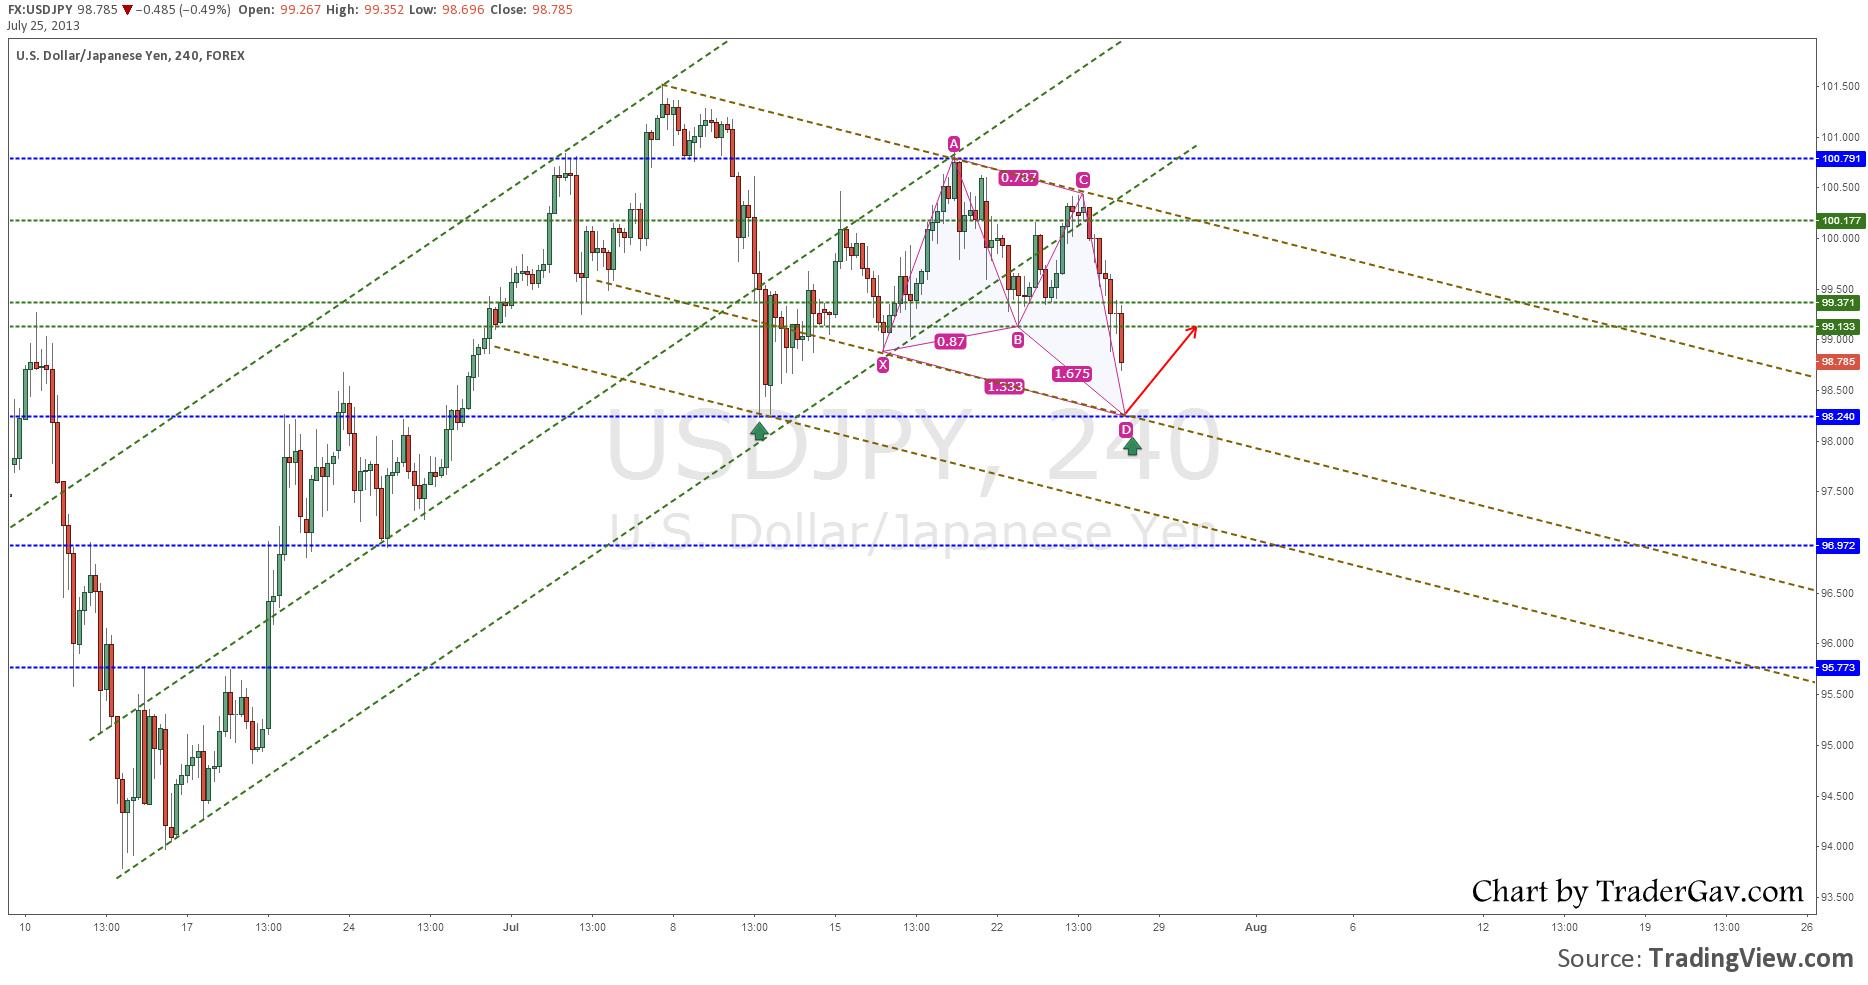
USDJPY

98.25 is the immediate target for now. And this is also the level to watch for any potential bounce.

I am interested in watching this level for potential false break before attempting long position.

USDJPY H4 26 Jul 2013

Filed Under: Harmonic setups, headline post, Trading Journal

The 7-year-old trading blog and new plan

by Gav 4 Comments

TraderGav.com is now 7 years old!

After trading and blogging for 7 years, the passion (or addiction!?) is just getting stronger. No sign of stopping. After having a brief hiatus and also working on other project, I have decided to revamp the site, reorganize the content, and redesign the look and feel. Here we have the new TraderGav.com. What do you think? Personally, I totally love it.

TraderGav.com remains my main outlet to share my thoughts, analysis, and trading ideas. Hopefully, materials posted here do help some of you.

I have reorganized the contents of the blog to showcase the important elements (You can view the new sections from Home screen):

Learn Trading

This section consists of the blog posts I have written over the years while I was learning to trade (I am still learning though). I do believe some of these posts provide useful information to new and developing traders.

Trading Tools

This section listed out the posts related to all the trading tools (free tools, or purchase required) I have used and reviewed. It could be software, hardware, trading course or just some random links. I will tell you up front, for some of the products, I am affiliate of them, so I am receiving commission if any readers decided to purchase. But, be assure that, I am not paid to write review for them.

Harmonic Trading

Long time readers might know harmonic patterns are part of my trading strategy. I don’t trade them exclusively, but they are certainly one of the important elements of my trading plan. This section consists of the past posts that I have written related to this subject.

Dummy Collection

Classical section. I started futures trading back in 2006. And this is the first, and most important technique that I have learned. This section lists out the futures trading journals related to Dummy style.

Support and Resistance

This is one of the most important tools in my trading. Here are the posts that related to this subject.


Here is what I have in plan for the future development of TraderGav.com :

  • Free weekly newsletter. I love sharing charts and analysis. And I have figured out the more efficient way is to organize my work into a short weekly newsletter. I am still looking for the best way to do this. I am working on setting up a free membership section, but it is work-in-progress. For the time being, the newsletter will be send via email.  If you are interested in receiving the newsletter, please do sign up at the subscription form on the sidebar or mainpage.
  • A sample portfolio. Particularly for swing trading. I will share my trading ideas on the blog and also the newsletter, and track the ideas, manage the trades on the portfolio page. I might or might not hold the position in my live account, but that’s not the point. This section is just to share and hopefully discuss with readers, the techniques to find trading opportunities, and trade management.  The last thing you want in trading and blogging is STRESS. So remember, this is purely educational.

So, here it is. Giving the new life to a 7-year-old trading blog. This is definitely not a website of a trading guru. Instead, a trading blog to share and learn.

Filed Under: headline post

  • « Go to Previous Page
  • Page 1
  • Interim pages omitted …
  • Page 7
  • Page 8
  • Page 9
  • Page 10
  • Go to Next Page »

Primary Sidebar

Best Tools For Traders

Recommend FX Charting

Footer

Recommended FX Charting

Recommended Training

FXSAnalytics
Price Action Course for Professionals

Copyright © 2025 · Affiliate Disclosure · Privacy

We use cookies to ensure that we give you the best experience on our website. If you continue to use this site we will assume that you are happy with it.Ok