• Skip to primary navigation
  • Skip to main content
  • Skip to primary sidebar
  • Skip to footer

TraderGav.com

Gav's trading blog - Perseverance, Consistency, Confidence

  • Home
  • Start Here
    • Back to Basics of Trading
    • Resource For Traders – The Best Tools for Traders
    • Learn Trading Articles
    • Sierra Chart Resource
  • Blog
    • Blog Posts
    • Other learning resource
    • Dummy Collection
    • Harmonic setups
  • About Me

headline post

EOD contextual view of Bund, Stoxx, ES 17 May 2016

by Gav Leave a Comment

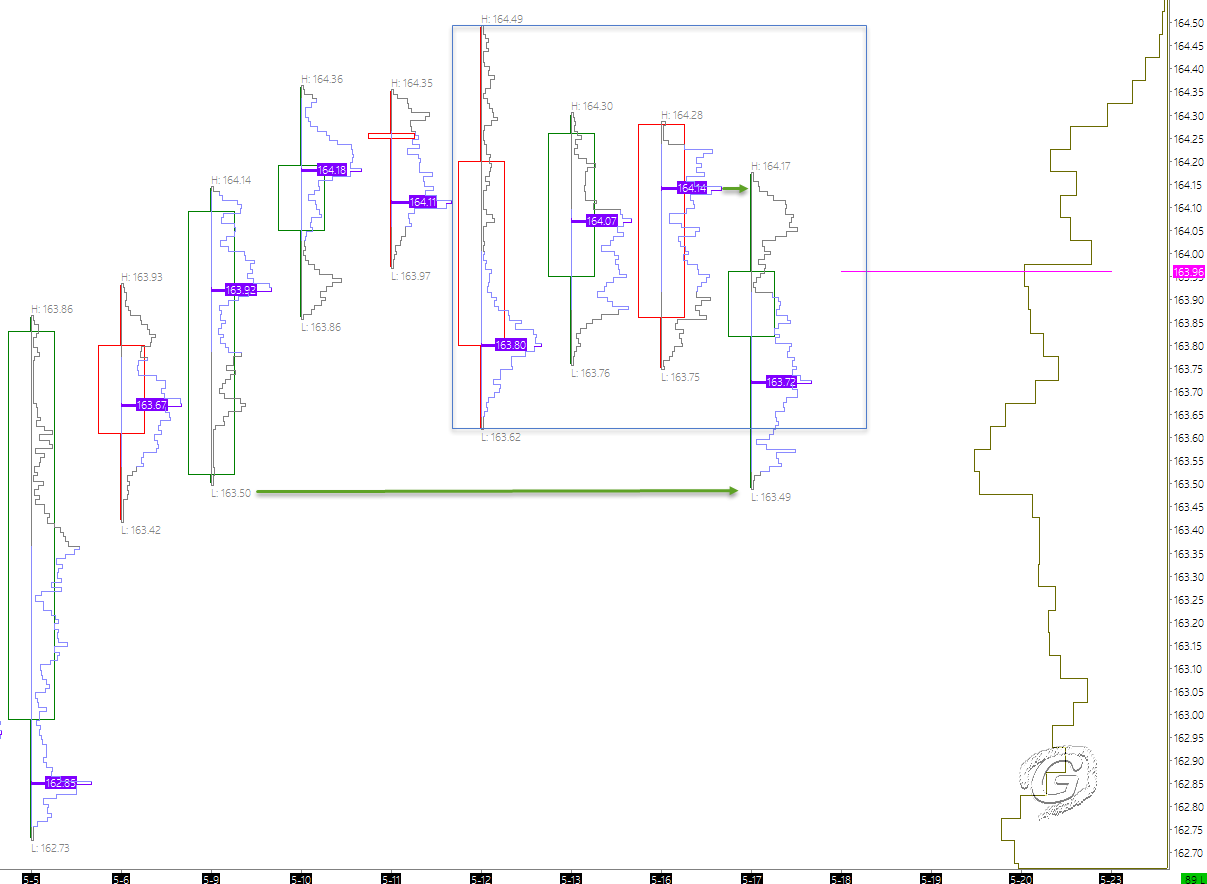
Here are quick EOD view of the 4 instruments I am trading.

Key summary:

  1. Bund (FGBL) did a one-tick test of 09 May 2016 low yesterday.
  2. Stoxx (FESX) inside day breakout failure
  3. Emini S&P futures (ES) failed test of Monday VPOC, and seeking lower balance
Bund (FGBL) 1-tick test of 09 May 2016 low
Inside view of Bund 1-tick test
Stoxx (FESX) inside day breakout failure
ES tested Prev VPOC
ES tested Prev VPOC


All charts prepared using Sierra Chart.

Filed Under: Footprint, headline post, Market Profile, Trading Journal

Sierra Chart Book sharing: Trading DOM template

by Gav 5 Comments


Sierra Chart Trading DOM

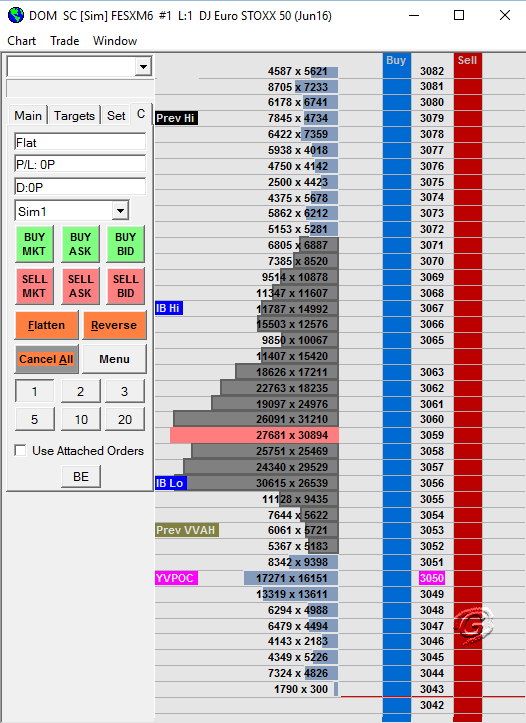
Sierra Chart is always my preferred choice of charting and trading platform. This post is not to introduce Sierra Chart (I will come to that in the future), but to share chart templates I have used in my trading. (Hopefully I can make this into a series of posts and sharing more templates in the future.) I thought it might be helpful to new Sierra Chart users.

I have done some customizations to the Trading Chart DOM, which will plot key reference points such as Previous High/Low, Previous Value Area High/Low,  Initial Balance etc automatically on DOM. You can always utilize Study Overlay function to plot additional information on the DOM.

Download the chart book and save it into Sierra Chart Data Files Folder, and Go to Sierra Chart and select File >> Open Chartbook . Feel free to customize it or share it to other Sierra Chart user if you like.

Download Here

*While this version of DOM is working well, I made some changes. New version of DOM template can be found HERE

Tips (no obligation!)

Filed Under: headline post, Sierra Chart Resource

AUDUSD chart update 23 March 2016

by Gav Leave a Comment

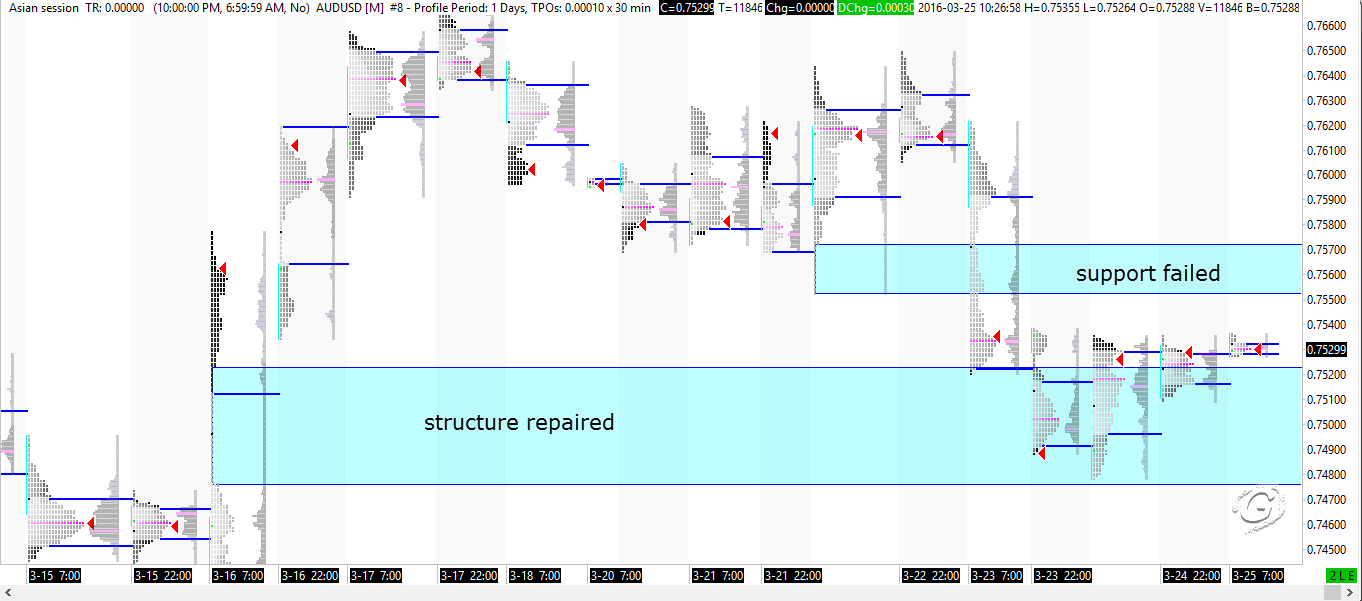
Refer to previous post for levels and structure identified.

7476-7528 single prints was repaired.

AUDUSD Market Profile review 25 March 2016


AUDUSD H1 review 25 March 2016

Charts prepared using Sierra Chart.

Filed Under: headline post, Market Profile, Support Resistance, Trading Journal Tagged With: AUDUSD, Key Levels, Trading Journal

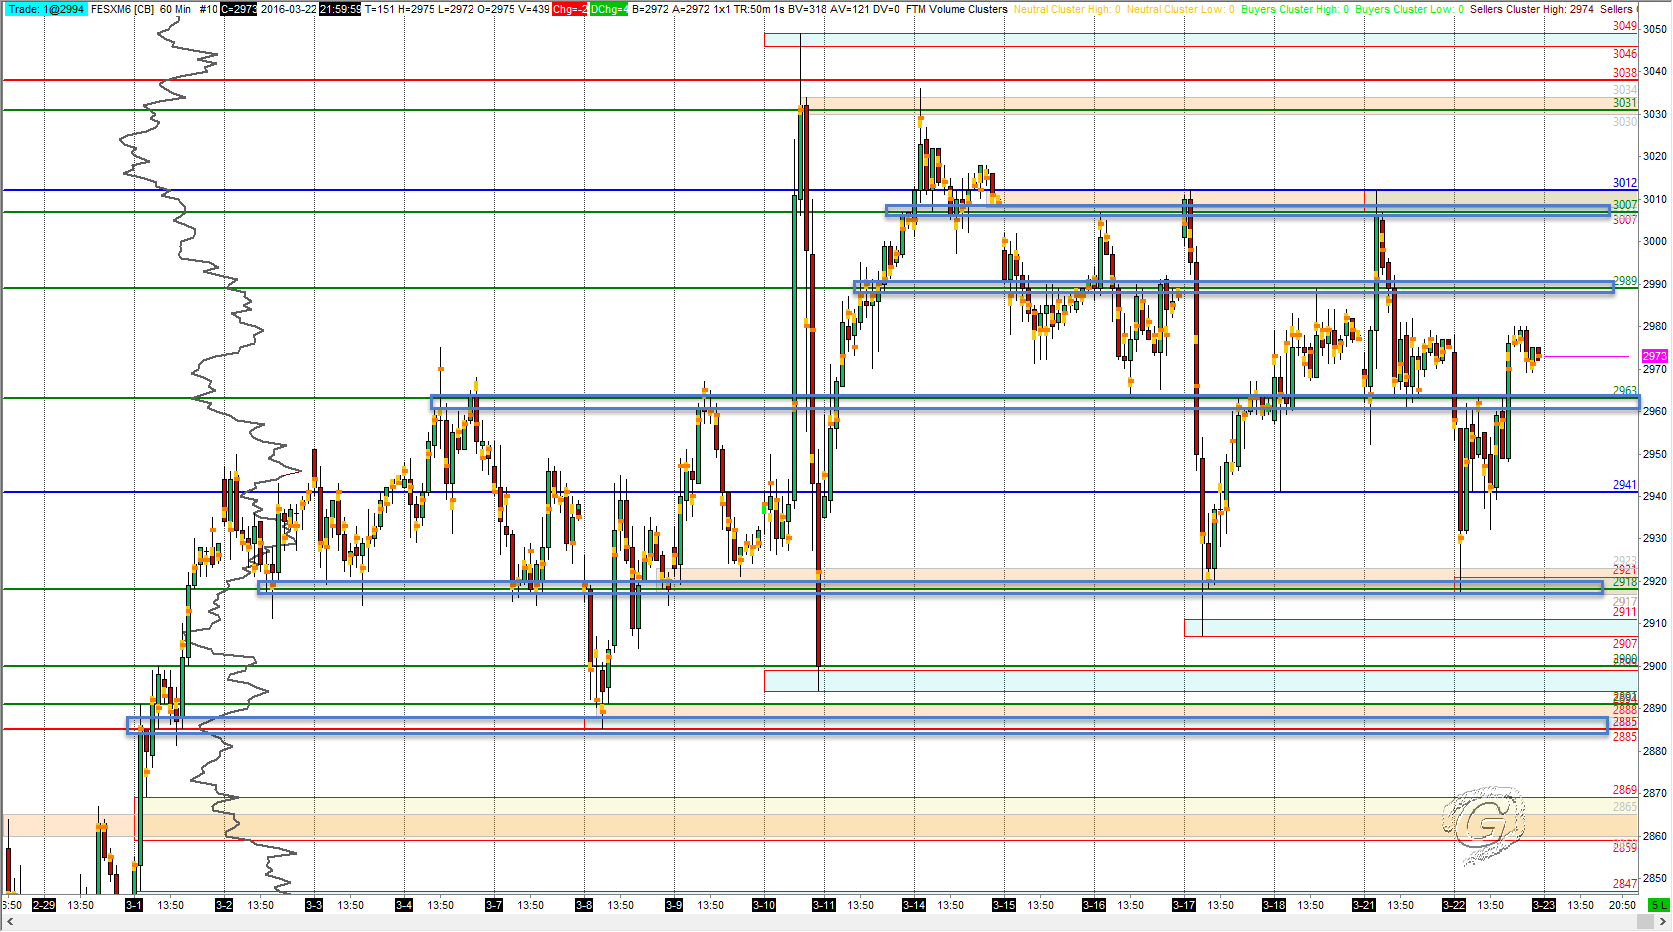
FESX 23 March 2016 EOD review

by Gav Leave a Comment

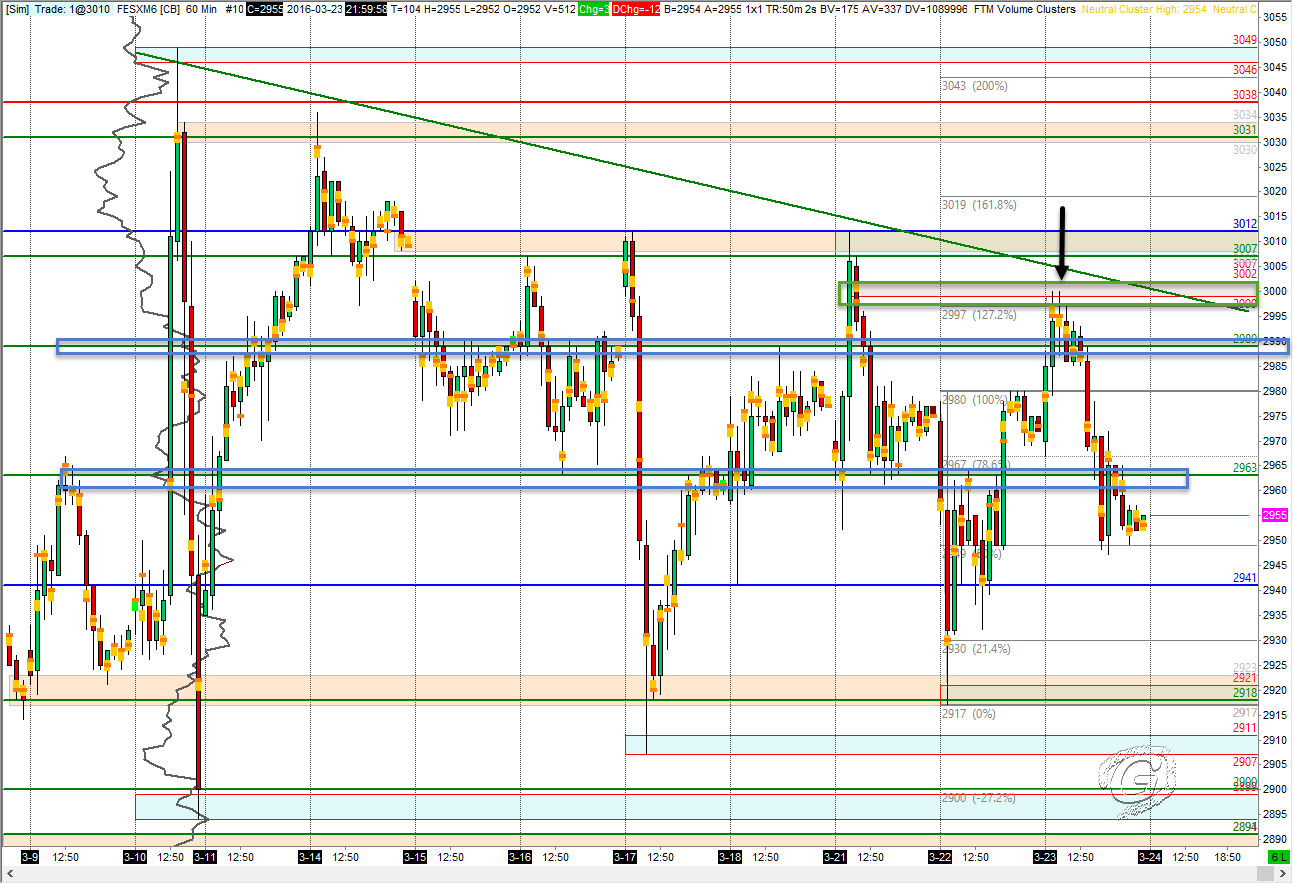
Refer to Pre Market post for key levels.

Yesterday’s poor high was retested in the morning session, and stoxx reversed around 3000 which was also 127.2% extension of previous day’s range. It was a slow grinding morning session as you might have read from my tweets.

#stoxx since open .. pic.twitter.com/fpSP78Vbrg

— Gavin M™ (@tradergav) March 23, 2016


Anyway, by the late afternoon session, Stoxx finally tested the NVPOC 2950.

Here are some charts.

FESX 23 March 2016 EOD H1

FESX 23 March 2016 EOD H1

FESX 23 March 2016 EOD market profile

All charts prepared using Sierra Chart

Filed Under: headline post, Market Profile, Support Resistance, Trading Journal Tagged With: FESX, Key Levels, Trading Journal

AUDUSD 23 March 2016 levels to watch

by Gav Leave a Comment

Here are the levels of interest for AUDUSD.

AUDUSD Hourly chart 23 March 2016
AUDUSD 23 March 2016

Chart prepared using Sierra Chart.

Filed Under: headline post, Market Profile, Support Resistance, Trading Journal Tagged With: AUDUSD, Key Levels, Trading Journal

Pre market FESX 23 March 2016

by Gav Leave a Comment

Yesterday, stoxx closed with poor high.

Market profile Pre open 23 March 2016


H1 levels 23 March 2016

Filed Under: headline post, Market Profile, Support Resistance, Trading Journal Tagged With: FESX, Key Levels, Trading Journal

  • « Go to Previous Page
  • Page 1
  • Page 2
  • Page 3
  • Page 4
  • Interim pages omitted …
  • Page 10
  • Go to Next Page »

Primary Sidebar

Best Tools For Traders

Recommend FX Charting

Footer

Recommended FX Charting

Recommended Training

FXSAnalytics
Price Action Course for Professionals

Copyright © 2025 · Affiliate Disclosure · Privacy

We use cookies to ensure that we give you the best experience on our website. If you continue to use this site we will assume that you are happy with it.Ok