
Ever sat in front of your screen, finger hovering over the buy button, heart pounding like you’re about to defuse a bomb? Yeah, me too. It’s called “Afraid to Trade” syndrome, and it’s the silent killer of retail traders—especially those with small accounts. Why? Because hesitation is expensive. The market doesn’t wait for you to […]
Back to Basic
22 years of Trading: A Twitter Thread Worth Reading [2022]
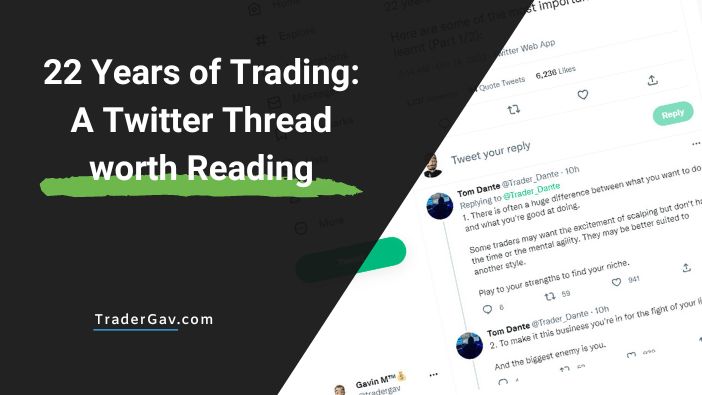
An excellent Twiitter thread shared by an experienced trader. Worth reading for both experienced and new traders alike.
What is Mean Reversion Trading Strategy

Mean Reversion could be a powerful trading strategy. In this blog post I want to show you what is mean reversion trading strategy.
How to trade with ATR (Average True Range)
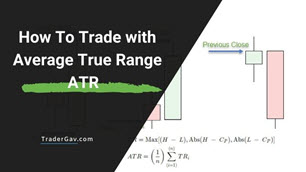
ATR could be one of the most powerful trading tool. Here is the guide of How to trade with ATR
Linda Raschke’s 50 Time-tested trading rules
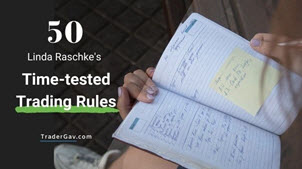
I first published this list in 2006. You’ve probably read about them before. Time to review your trading rules.
Here is the 50 time-tested trading rules by Linda Raschke
Most Useful Candlesticks Patterns

Use them with the right market context, candlesticks patterns could be valueable.
Here is the list of 14 Most useful Candlesticks Patterns.

