• Skip to primary navigation
  • Skip to main content
  • Skip to primary sidebar
  • Skip to footer

TraderGav.com

Gav's trading blog - Perseverance, Consistency, Confidence

  • Home
  • Start Here
    • Back to Basics of Trading
    • Resource For Traders – The Best Tools for Traders
    • Learn Trading Articles
    • Sierra Chart Resource
  • Blog
    • Blog Posts
    • Other learning resource
    • Dummy Collection
    • Harmonic setups
  • About Me

Blog and Rants

Some levels trading lesson from USDJPY

by Gav Leave a Comment

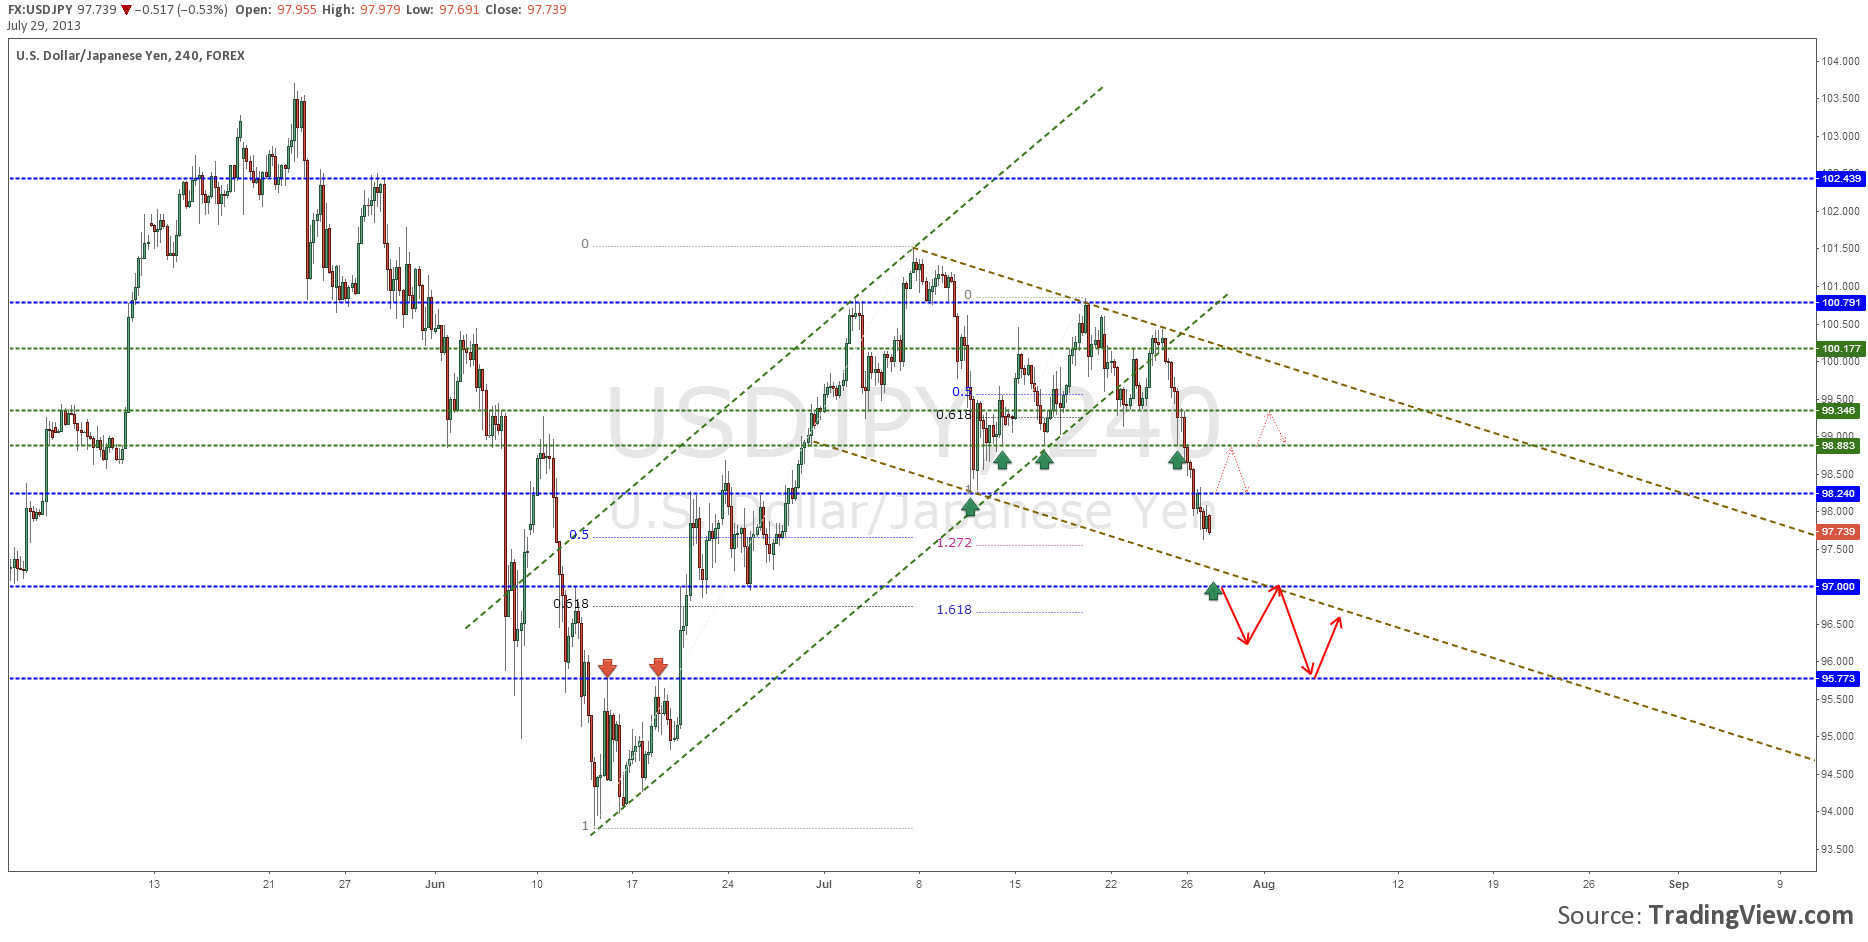
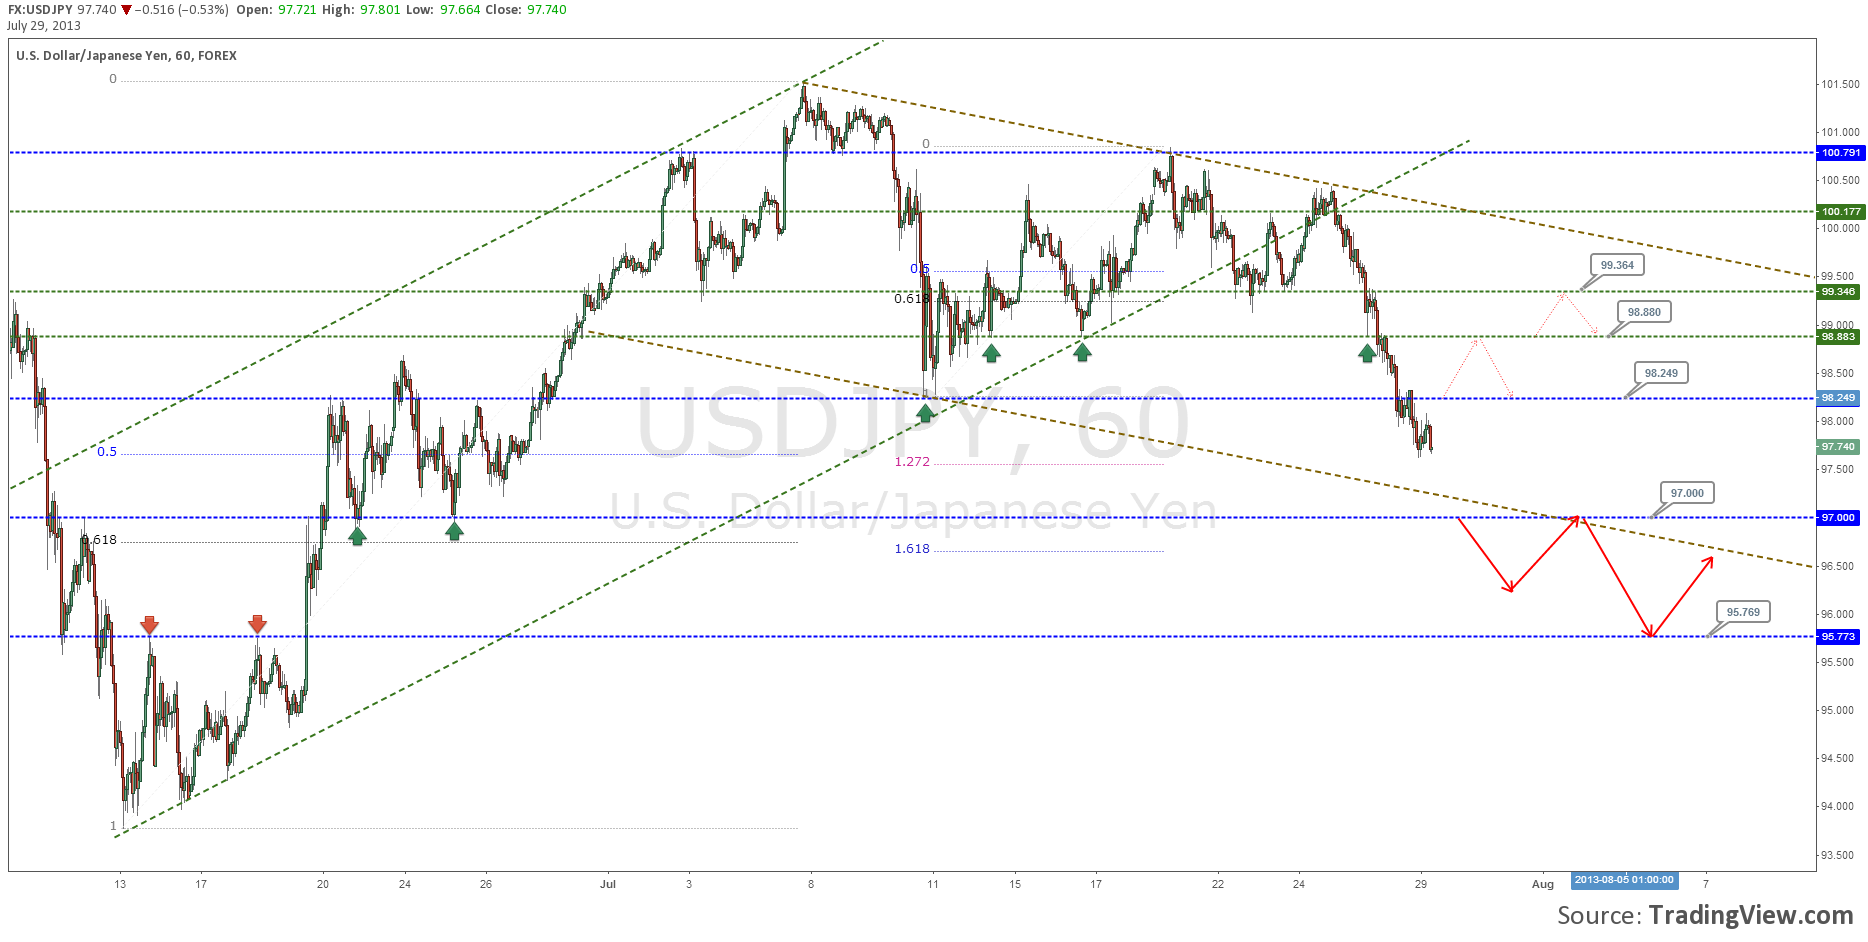
I thought I will write a quick follow up of the USDJPY development. Well, in the bigger picture, price is still trading within the channel as shown in my previous post Here and Here. However, there are some developments in Hourly time frame which I can use to show how I approach the levels. This is definitely not a post to show off how many hundreds of micro, nano pips that I have gained nor to whine about missing/losing trades.

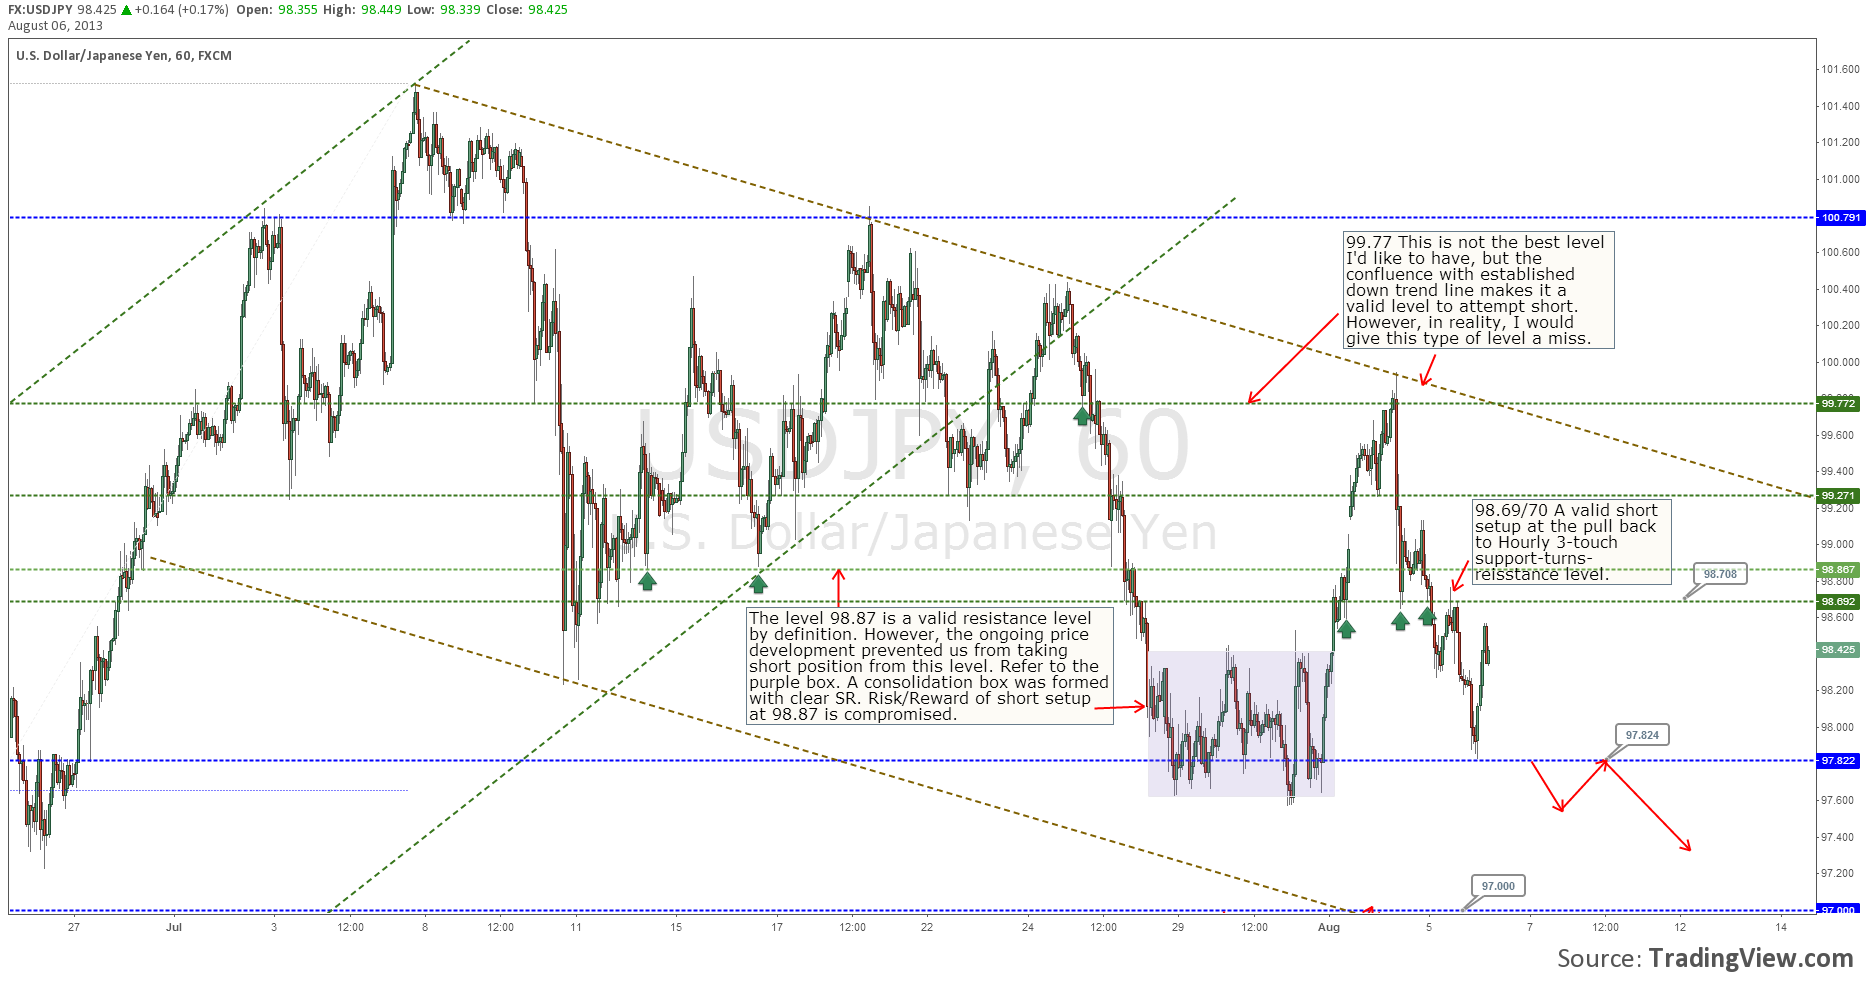
Anyway, I have annotate the chart with my comments. Hopefully it helps some of my 12 readers.

The key notes here are:

  • The importance of observing on-going price development A valid level is not taken due to risk/reward ratio has been compromised. This happens when a price does not continue selling (or buying) as expected, instead it creates a base with forming new support and resistance levels.
  • When a level is not the strongest according to our plan, always look for more confluence factors.

Here is the hourly chart of USDJPY (click to magnify the chart)

USDJPY 1-Hour chart 06 August 2013

Leave me a comment for any question you might have.

From the desk of TraderGav.com

Filed Under: blogs, Learn Trading, Support Resistance, Trading Journal

My Harmonic trading guide

by Gav 3 Comments

I have been posting some harmonic setups over the years, I thought maybe a simple harmonic trading guide might help readers who are following this type of trading. For the harmonic patterns I am using, there are some Fibonacci ratios to follow. They might look complicated, but they are not. Once you get the hang of them, it is not too difficult to identify.

One of the important things to note is, I do not trading harmonic patterns exclusively. The patterns are used as an aid to my over analysis, an odd enhancer you may say.

Secondly, I prefer to look at harmonic patterns in higher time time frames, such as 4 hours and daily. This is not to say the patterns do no work in lower time frame, it is just personal preference. I found that the patterns work well in medium to longer term swing trading.

For the start, harmonic patterns are divided into two categories, Extension patterns and Retracement patterns.

  • Extension patterns are Bullish Butterfly, Bearish Butterfly, Bullish Crab and Bearish Crab.
  • Retracement patterns are Bullish Gartley, Bearish Gartley, Bullish Bat and Bearish Bat.

These are the patterns that I used, and the list is not exhaustive. The “hardcore” harmonic traders might look at more patterns such as 5-0, Shark etc and in more time frames.

So here are the key factors I am looking at when using harmonic patterns

  • Identify key market levels, in other words, key support resistance levels. This one of the MOST important step.
  • Identify established price channel. A channel also represent the current trend, applying the appropriate patterns to follow the trend.

Harmonic Trading Guide

Below are the patterns with respective Fibonacci ratios. I also prepared two simple cheat sheets in PDF forms for readers who would prefer to print it out.

Harmonic Trading Guide - TraderGav.com
Harmonic Extension patterns
Harmonic Retracement patterns

My opinion about harmonic trading is, Do Not Complicate things. Keep it simple, be clear with what you are doing, are you using the patterns as entry trigger? or are you using them for directional bias setting (I will discuss more on this in the future posts),  and, as always, make sure the patterns are forming in the right place, i.e key levels or channels.

Here are the cheat-sheets in PDF format that I have prepared in case you prefer a printout.

Extension patterns

Retracement patterns

You can also find my harmonic setups/charts in Harmonic trading posts section

From the desk of TraderGav.com

Filed Under: blogs, Harmonic setups, Learn Trading

Trading setup: Immediate retest of broken support and resistance level

by Gav 1 Comment

Very often, on twitter or forums, I see people posting some simple trading setups, and give them some odd names, then call it their inventions. Laughable indeed. Anyway, kudos to them for providing some amusements.

One of the most commonly seen setup is Immediate retest of broken support/resistance level. Well, regardless of the names given by “traders”, let’s have a look at it a little b it closer.

If I really wanna trade the immediate retest, there are three conditions I wanna see before establishing a position:

Strong level

Immediate retest of a level works, when it is against a strong level. It could be a horizontal support and resistance level, or diagonal trend line. A strong support or resistance level is the one that was formed by multiple touches in the inverse direction before it is broken. For example, a strong support is a level that was formed by a broken resistance level where there were multiple resistance points, in other words, multiple swing highs. Vice versa  for strong resistance level.

So, for the first condition, I want to see a break of level which was constituted by at least 3 swing points (or 2 with other confluence factors)

Strong breakout

Secondly, I want to see a strong break of the level. A slow grinding movement is avoided. Often times, it might turn out to be a false breakout. So, a STRONG breakout bar is what I would like to see.

Continuation pattern

A continuation pattern can be as simple as a small consolidation price cluster following a strong breakout. The basic idea is to have Breakout -> Consolidation ->Breakout scenario.

Here are some charts to demonstrate this setup.

AUDUSD immediate retest explain
AUDUSD immediate retest explain (click for bigger chart)

EURUSD Immediate retest explain
EURUSD Immediate retest explain (click for bigger chart)

So, here is the simple support resistance setup. Of course, this is not a complete trading strategy. Just some tips for you to consider before taking an immediate retest setup. Err… Shall I also name it as Butt Kiss Setup!


From the desk of TraderGav.com

Filed Under: blogs, Learn Trading, Support Resistance, Trading Journal

Weekly Review of GOLD (XAUUSD) 30 JUL 2013

by Gav Leave a Comment

GOLD XAUUSD Daily chart

In my previous post, we have identified the potential resistance zone around 1335. We are right there now. I would like to see a turn at this area, and projected target is at 1000 should the selling resumes.
But, it is not as simple as it sounds. There are road blocks in front of us.
let’s zoom into H4. I expect to see some good support around 1300. A break of H4 uptrend line (golden line in the chart) and 1300 support should provide some ‘feel good’ factors for bears to initial shorts again.
First target for the short side is the last swing low around 1180 , and 2nd is the completion of ABCD formation at 1000. Maybe the targets are over ambitious, but who knows? That’s the plan for now.

GOLD XAUUSD 4-Hour chart

On the other hand, in case failed to ignite the selling engine, next resistance level is seen at area of 1527. Have a look at the weekly chart below. The ABCD projection is definitely hypothetical and extremely ambitious. We will review the price action later.

Gold XAUUSD Weekly chart

That’s all for now. What do you think? Let me message at the comment section.

From the desk of TraderGav.com

Filed Under: Harmonic setups, headline post, Support Resistance, Trading Journal

Waiting for the nobrainer trades AUDUSD USDJPY

by Gav

AUDUSD

Aussie remains trapped within the trading range. You can trade your range play strategies, I prefer to wait for nobrainer setups. 0.93 is still the key level to watch for any bullish movement. 0.9030 is the immediate support area to watch. A break of these levels will interest me.

AUDUSD 4-hour chart
AUDUSD 4-hour chart

For short term intraday trading, there are some levels to watch within the range. 0.9230 is the support level I watching. As a personal preference, I like to trade the reversed level, in other words, I prefer the break of support and initiate a short position at the pull back.
The next immediate support is seen at 0.9170 ish, and 0.9110.

Here is the hourly chart of AUDUSD with key levels marked.

AUDUSD 1-Hour chart
AUDUSD 1-Hour chart

USDJPY

The false break at the 98.25 level as mentioned in my previous post did not happen. USDJPY did not manage to close above the level. Instead we are likely to head to 97 now.

Here is the H4 chart of USDJPY with key levels marked.

USDJPY 4-hour chart
USDJPY 4-hour chart

And here is the H1 chart of USDJPY

USDJPY 1-hour chart
USDJPY 1-hour chart

That’s all for now. More later. Remember, it is NFP week, so keep trading if you want, and be cautious.

Filed Under: headline post, Support Resistance, Trading Journal

USDJPY level to watch 26 Jul 2013

by Gav Leave a Comment

USDJPY

98.25 is the immediate target for now. And this is also the level to watch for any potential bounce.

I am interested in watching this level for potential false break before attempting long position.

USDJPY H4 26 Jul 2013

Filed Under: Harmonic setups, headline post, Trading Journal

  • « Go to Previous Page
  • Page 1
  • Interim pages omitted …
  • Page 25
  • Page 26
  • Page 27
  • Page 28
  • Page 29
  • Interim pages omitted …
  • Page 226
  • Go to Next Page »

Primary Sidebar

Best Tools For Traders

Recommend FX Charting

Footer

Recommended FX Charting

Recommended Training

FXSAnalytics
Price Action Course for Professionals

Copyright © 2025 · Affiliate Disclosure · Privacy

We use cookies to ensure that we give you the best experience on our website. If you continue to use this site we will assume that you are happy with it.