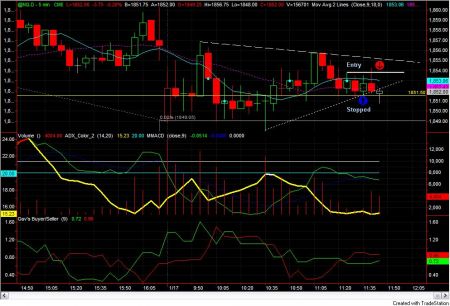
• Skip to primary navigation
  • Skip to main content
  • Skip to primary sidebar
  • Skip to footer

TraderGav.com

Gav's trading blog - Perseverance, Consistency, Confidence

  • Home
  • Start Here
    • Back to Basics of Trading
    • Resource For Traders โ€“ The Best Tools for Traders
    • Learn Trading Articles
    • Sierra Chart Resource
  • Blog
    • Blog Posts
    • Other learning resource
    • Dummy Collection
    • Harmonic setups
  • About Me

Blog and Rants

Personality test

by Gav 5 Comments

Eyal has posted a link of personality test. I find to be useful. Maybe one should take this test before writing his trading plan.

btw, I am ISTJ according to the test

Filed Under: Rant Tagged With: fun

Indicator or Indicatorless-Should you use indicator?

by Gav Leave a Comment

Should you use indicator?

This started from yesterday when I was proudly showing my Adjusted TRIN and Buyer/Seller Index to my fiancee because I thought it was so cool. Well, I guess the colored lines on the chart were meaningless to her. She said:” When you first started dummy trading, you were trying to get rid of these indicators, now why are you messing up the chart again?” ah well…

I am not a big fan of technical indicators. In fact, I can’t even understand and apply Stochastics properly (maybe, I just did not put enough time in this area)

Should You Use Indicator?

I have always heard or read about, “Follow the price action is enough”, or “Indicators are useless” from anonymous traders who sound like a pro (or pretend to be one) blah blah blah.

To a certain extend, I agree with them. You can’t rely on an indicator to make a living in the trading business. But are indicators really useless? I don’t really think so.

Ok, first, I try to understand the construction of a technical indicator, as well as the construction of the understanding of price action in my mind.

Technical indicators are some arrangements of price. The creator reads charts trying to understand the price action and subsequently uses mathematics presentation to analyze the price action and finally plots it on the screen. Here we have our “Superman Index oscillator”. The indicator that was designed according to the creator’s understanding, and belief of the market.

Notice this, before a formula is developed, the creator, in fact, needs to read the price, understand it, blend it with his/her belief of “how does the market work” and subsequently turning it into mathematics. This is the process of development.

How about when we do it without an indicator?

Well, we again, read the price, understanding it, observe the volume, or looking at narrow range, and finally come to the conclusion that “the selling is over, it is time to buy in and the market should continue its uptrend.”

Notice the process.

In fact, the “Superman Index oscillator” was coded and executed in our mind. Instead of presenting it as a mathematical formula, we have done the processing in our mind (ok, our brain), then we say “Oversold, buy signal”.

Comparing these two processes, I really do not find very much difference. (Well, maybe it hurts the ego of a trader to pull in indicator into his chart. It makes him looks like an amateur).

The indicator is either drawn on your chart or in your mind.

I see the important components of an indicator: the belief of the trader and his/her understanding of price action. Each of us has our very own belief of market, such as “I see the market is not random, it is always moving to form a trend, etc”. So does the indicator creator.

To me, in order to use an indicator efficiently, I would prefer to understand the internal (construction) of the indicator. Well, you can read tons of charts, trying to observe some patterns of the indicator in relation to price action, however, when market condition changes, the indicator will fail. And you will never know the reason without knowing how it was created.

The problem of trading with technical indicator is that, trader tends to be lazy or being ignorance to understand the mathematics construction behind the scene.

Instead, he is focusing on looking for “overbought/oversold” lines, crossover points, etc. I don’t think reading some text description of a technical indicator are enough.

Understand the programming and mathematics behind, is the preferred way. Tough job though. If I can’t figure out the intention and the construction of the indicator, why do I want to risk my money trading with the indicator? (ok, some traders prefer backtesting the indicator before applying…)

Having said that, the best technical indicator is always the one that is created by yourself. It is just another way of explaining your understanding of market. You have your belief, understand and plan, you code it , and plot it on the chart. You trade with it, without much emotion hitches, you follow it. You are responsible to its success and failure.

Technical indicators can’t help you to understand price action. Instead, you should first understand price action and use the indicator that represent what you understand. Use it as a tool to reduce guess work.

Should you use indicator? It depends on what do you see in it.

Just another piece of my random rant on this topic.

On the side note, if you are interested in learning more about trading, check out my Back to Basics of Trading series.

Filed Under: blogs, Learn Trading Tagged With: Strategy & tools

Have a great long weekend

by Gav Leave a Comment

[photopress:counter.PNG,full,pp_image]

I did a quick check out of my blog before I go out for shopping. Look at the counter. Isn’t it great? You know what I am saying if you understand Cantonese (chinese dialect).
These numbers represent ????? which means A prosperous way to go! ๐Ÿ™‚

Filed Under: Rant Tagged With: blogging, fun

Review week ended 12-Jan-2007

by Gav Leave a Comment

Well, I achieve my goal, another profitable week. I missed the trade on Thursday, which was a mistake, I was not paying enough attention to trading. I start feeling good of strictly following my game plan. I basically traded with confidence.

I only make 3 trades this week. Two winners and 1 loser.

  • Total P/L (after commission): 2.7 R
  • Trades taken: 3
  • Winners: 2 (66.67%)
  • Loser: 1 (33.33%)
  • Expectancy: 0.9
  • Biggest winner (after commission): 2.84 R
  • Biggest loser (after commission): 1.07 R

Market is closed on coming Monday. Another Long weekend (well, not in Singapore though..)

Have a great weekend!

Filed Under: Trading Journal

Dummy day trading #44 12-Jan-2007: NQ Long trade closed

by Gav Leave a Comment

2nd trade of the day. Long position was established at 1215pm. That was the first pull back of new trend cycle. After getting stopped out in the first trade, I was extra patient to wait for a quality entry. Here it is. Small R. I trailed stop according to my plan and get stopped out with 3-R gain.

Trade summary:

  • Long above the high of 1215pm candle which was also the first pull back of new trend cycle.
  • Initial stop was set below 1215pm candle.
  • Profit stop was triggered at 1245pm.

One trade closed with 3-R gain.

12 Jan 2007
12 Jan 2007

This is the last trade of the week. I call it a day now.

Filed Under: Dummy Collection, Trading Journal Tagged With: Dummy Trading E-mini Nasdaq, Trading Journal

Dummy day trading #43 12-Jan-2007: NQ Long trade closed

by Gav Leave a Comment

Long position was established above 1015am candle. I was looking a high low and continuation of uptrend. Trade did not work out as expected, I was stopped out with 1-R loss.

Trade summary:

  • Long above high of 10th candle (1015am).
  • Initial stop was set below the low of 10th candle.
  • Stop loss was triggered.

One trade closed with 1-R loss.

[photopress:NQ5minTradeclosed.jpg,full,pp_image]

Filed Under: Dummy Collection, Trading Journal Tagged With: Dummy Trading E-mini Nasdaq, Trading Journal

  • « Go to Previous Page
  • Page 1
  • Interim pages omitted …
  • Page 151
  • Page 152
  • Page 153
  • Page 154
  • Page 155
  • Interim pages omitted …
  • Page 225
  • Go to Next Page »

Primary Sidebar

Best Tools For Traders

Recommend FX Charting

Footer

Recommended FX Charting

Recommended Training

FXSAnalytics
Price Action Course for Professionals

Copyright © 2025 ยท Affiliate Disclosure ยท Privacy

We use cookies to ensure that we give you the best experience on our website. If you continue to use this site we will assume that you are happy with it.