
Here are the charts for 12 March 2018 with zones of interest marked. Markets covered: 30yr US Treasury Bonds – ZB June 18 Contract 10yr US Treasury Notes – ZN June 18 Contract Ultra 10yr Treasury Note – TN June 18 Contract Basic Principle = Trade Location + Order Flow
Blog and Rants
EOD Recap 09 March 2018

Refer to pre market prep post here. Here are the EOD reviewed Charts. Markets covered: 30yr US Treasury Bonds – ZB June 18 Contract 10yr US Treasury Notes – ZN June 18 Contract Ultra 10yr Treasury Note – TN June 18 Contract The basic principle is Trade Location (zone) + Order flow analysis (Entry, Exit […]
Market Prep 09 Mar 2018 zone of interest
Here are the charts for 09 March 2018 with zones of interest marked. Markets covered: 30yr US Treasury Bonds – ZB June 18 Contract 10yr US Treasury Notes – ZN June 18 Contract Ultra 10yr Treasury Note – TN June 18 Contract Basic Principle = Trade Location + Order Flow
EOD Recap 08 March 2018
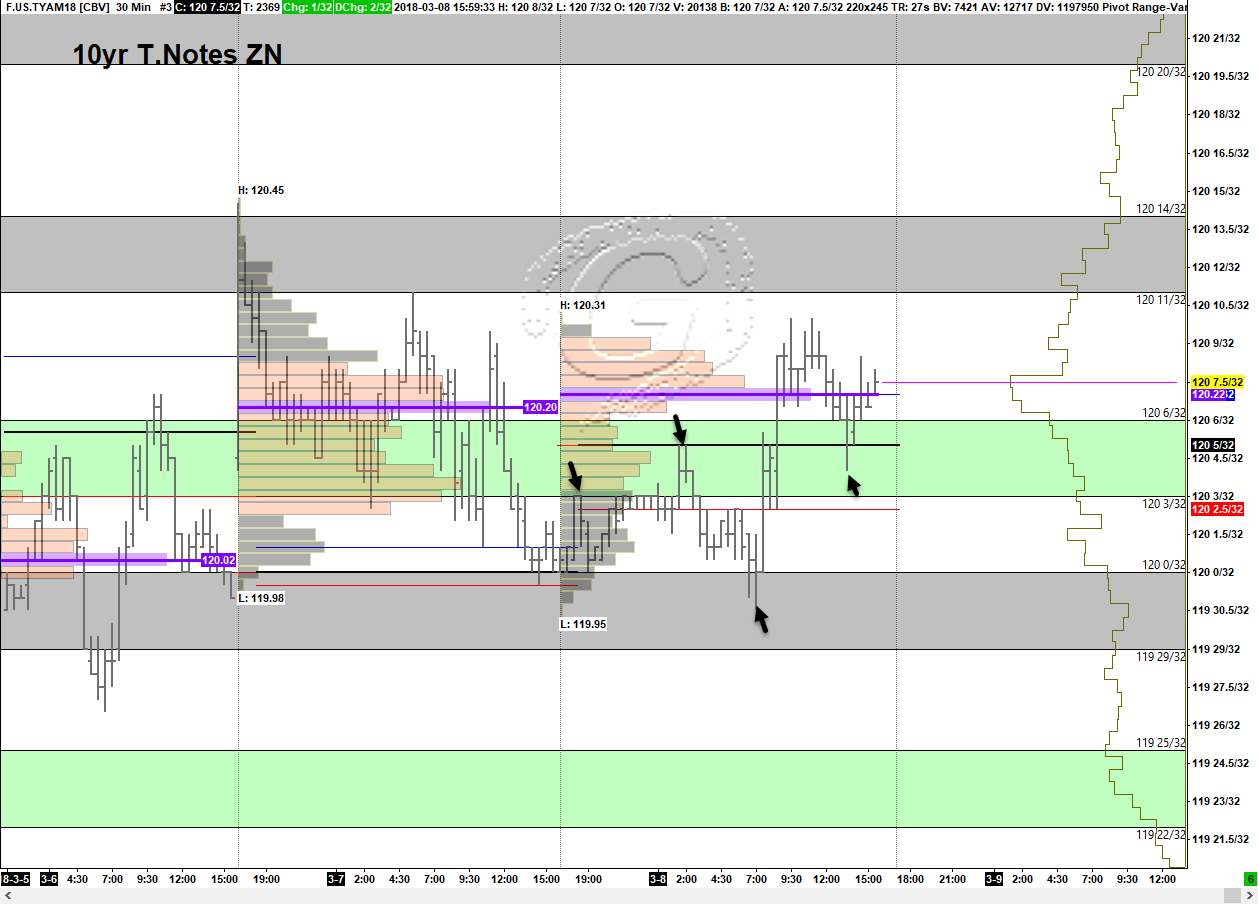
Refer to pre market prep post here. Here are the EOD reviewed Charts. Markets covered: 30yr US Treasury Bonds – ZB June 18 Contract 10yr US Treasury Notes – ZN June 18 Contract Ultra 10yr Treasury Note – TN June 18 Contract The arrows in the charts are not some magical top and bottom pickers, […]
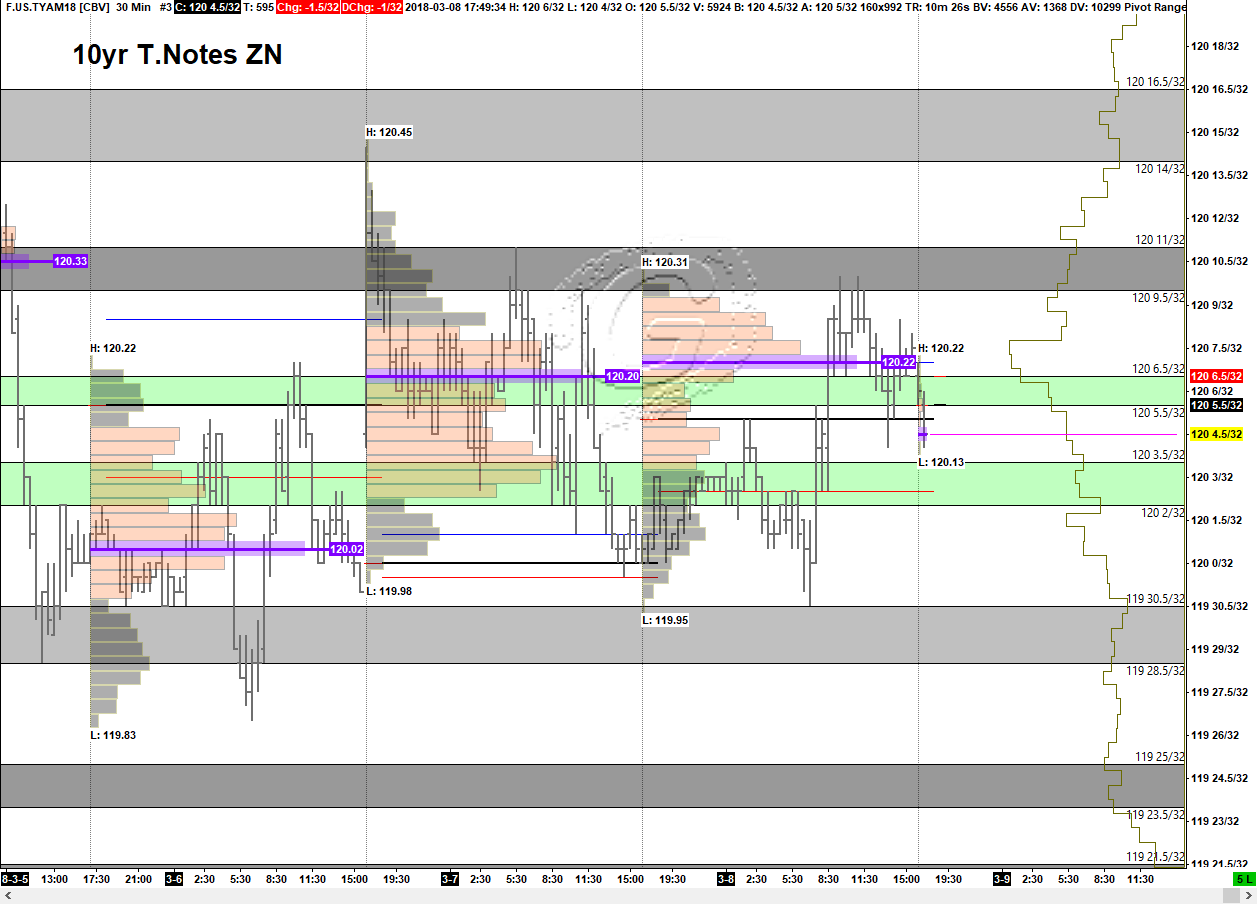
Market Prep 08 Mar 2018 zone of interest
Here are the charts for 08 March 2018 with zones of interest marked. Markets covered: 30yr US Treasury Bonds – ZB June 18 Contract 10yr US Treasury Notes – ZN June 18 Contract Ultra 10yr Treasury Note – TN June 18 Contract Basic Principle = Trade Location + Order Flow
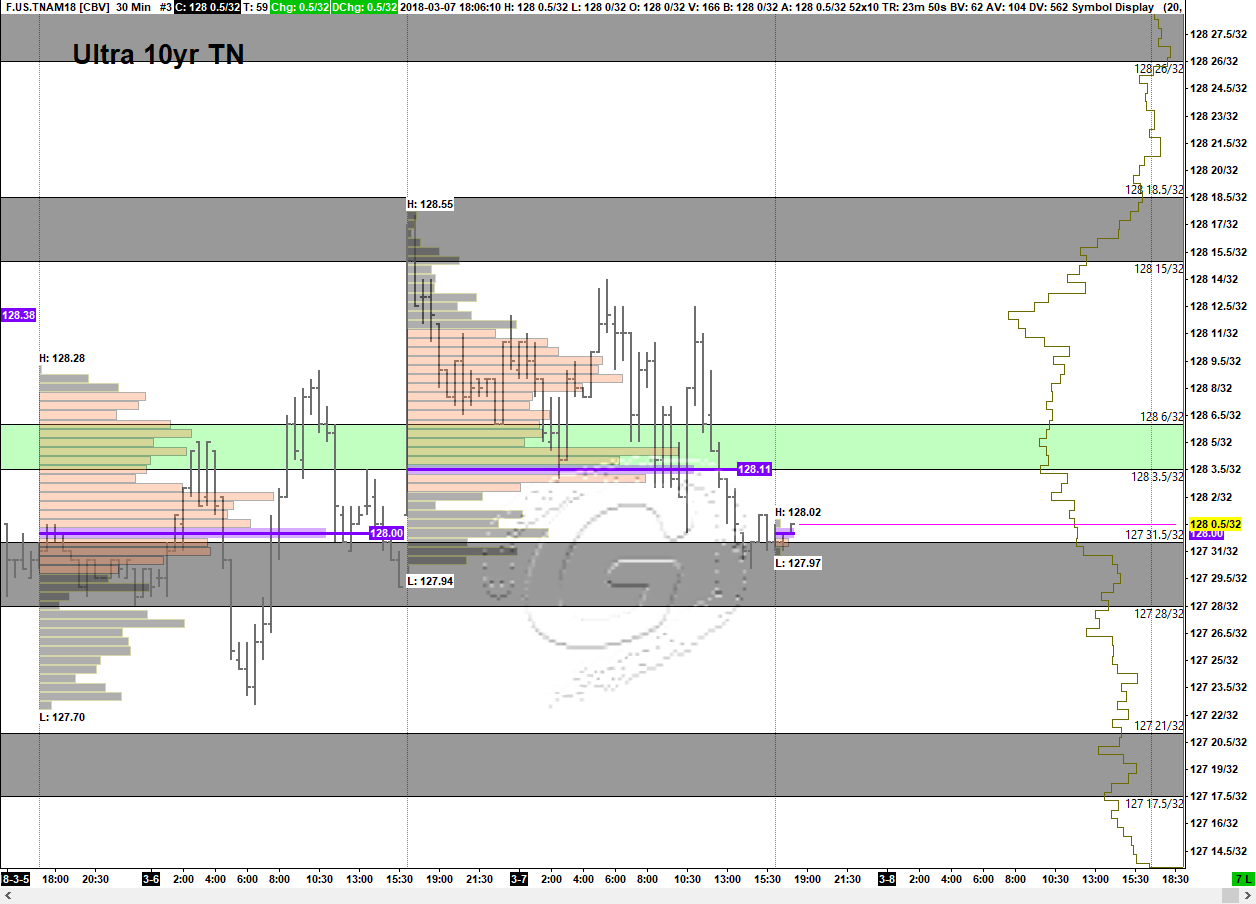
EOD Recap 07 March 2018
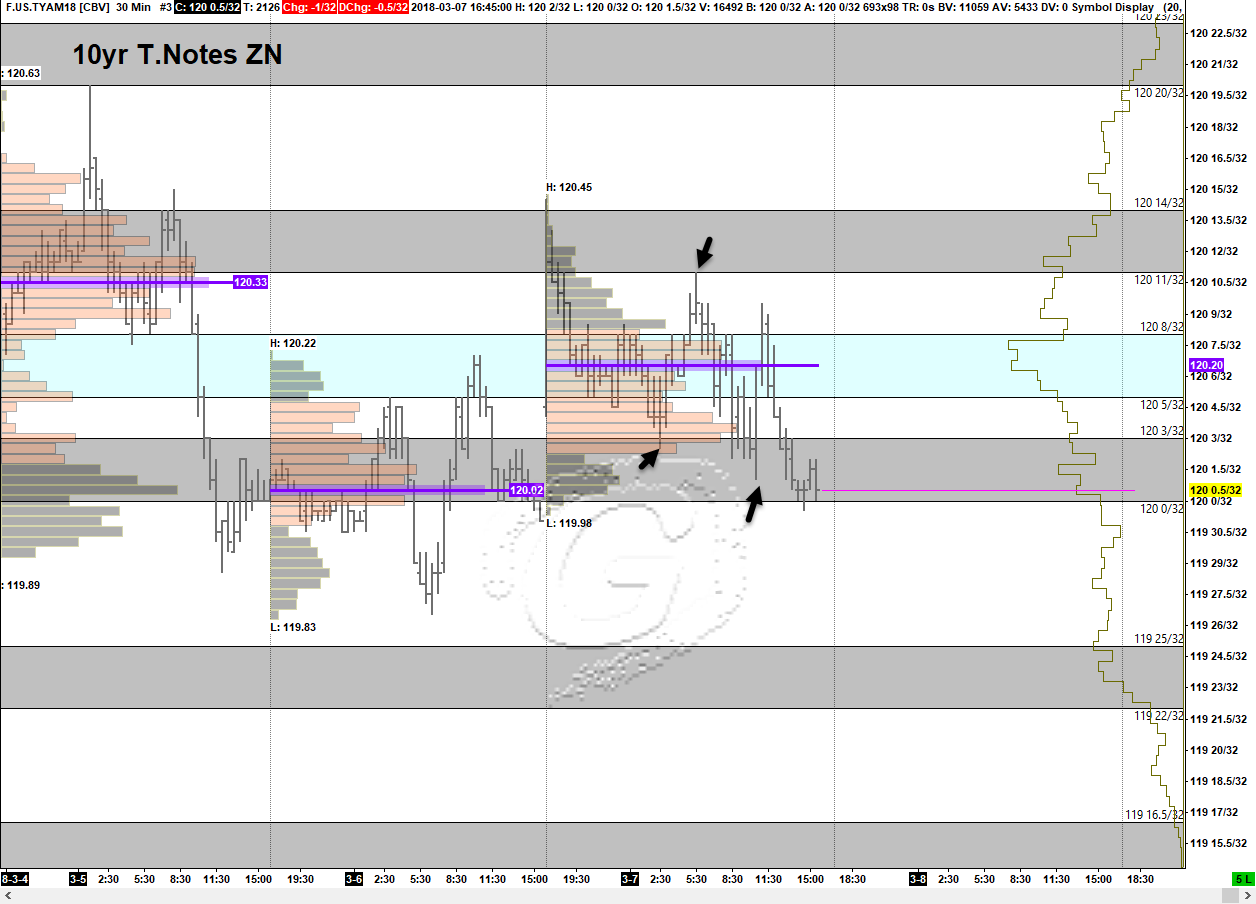
Refer to pre market prep post here. Here are the EOD reviewed Charts. Markets covered: Crude Light – CL June 18 Contract 30yr US Treasury Bonds – ZB June 18 Contract 10yr US Treasury Notes – ZN June 18 Contract Ultra 10yr Treasury Note – TN June 18 Contract The arrows in the charts are […]

