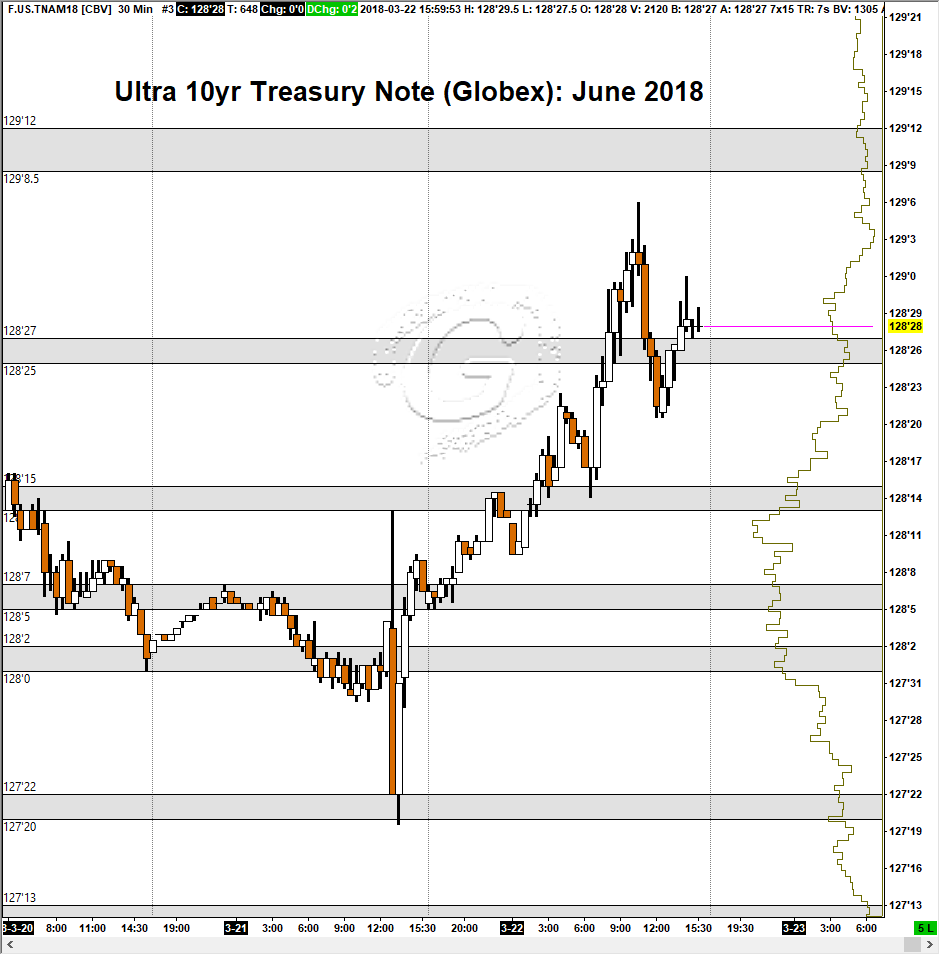
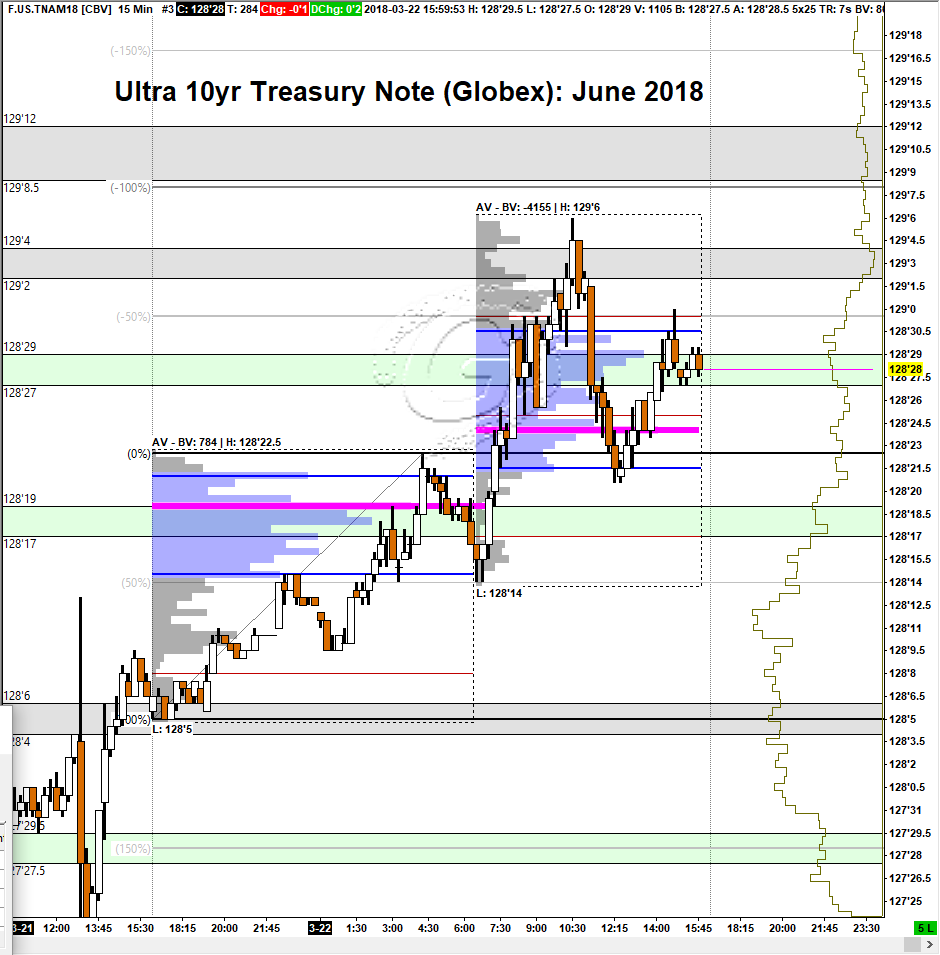
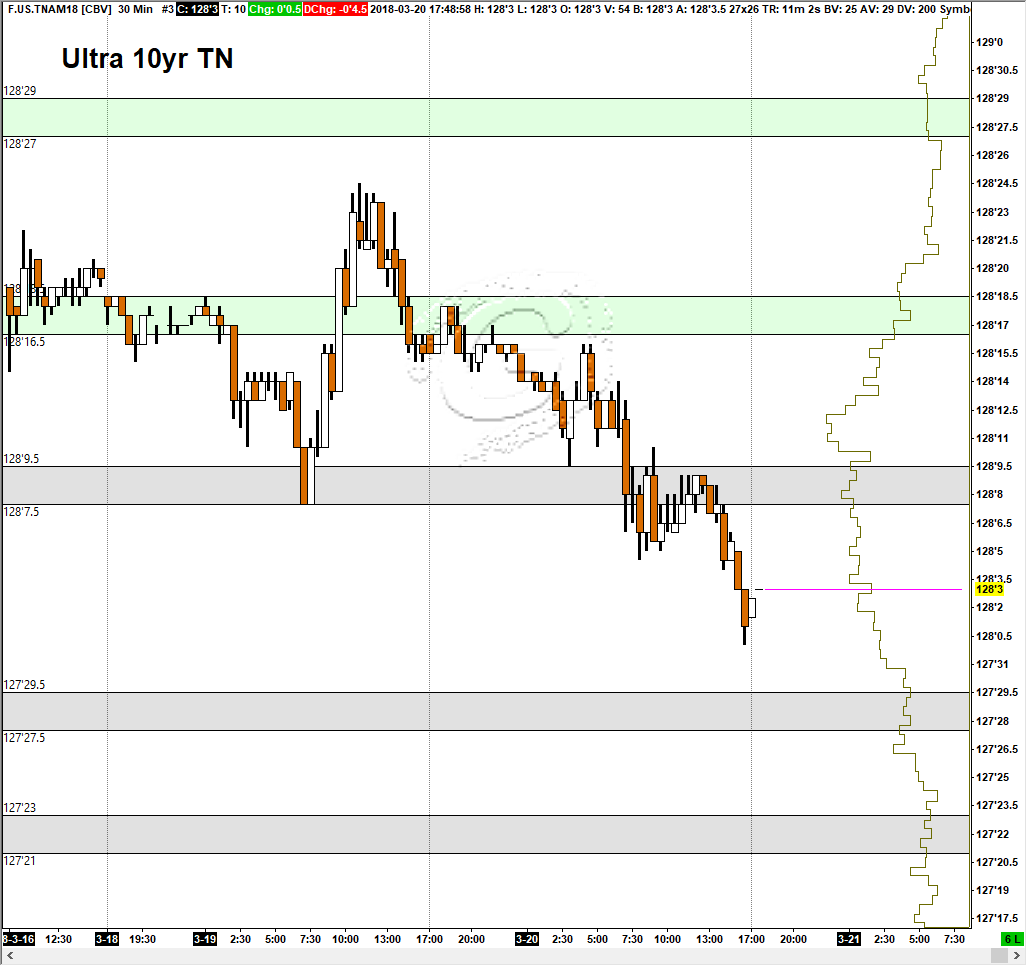
Here are the levels I am looking at for today’s session.
Time constraint, I will start with FESX for now, and with limited description.
Charts prepared using Sierra Chart.
Here are the levels I am looking at for today’s session.
Time constraint, I will start with FESX for now, and with limited description.
Charts prepared using Sierra Chart.
While I don’t normally write a blog post to promote product. I thought FXSAnalytics is one of few worth mentioning. If you are looking to learn price action trading, this is definitely a good place to start. FXSAnalytics consists of full series of lecture notes, support forum, reference sheets, and also a one-to-one skype call coaching with Steve from nobrainertrades.com. I have personally gone through the course material, and can confidently recommend it to blog readers.
The whole purpose of writing this post is to inform readers, Steve is running a limited time price cut for FXSAnalytic. From now to 2nd December 2015, you can enjoy 20% off the full price of entry. Below is the official announcement from FXSAnalytics.
(Update 11/30: Code has been extended to work through December 2nd).
It has been 11 months since the release of FXS Analytics, and in preparation of a major release to the platform we are offering a one-time extra discount to access materials and support. Valid through November 30th, coupon code TIMETOTRADE will take 20% off the full price of entry. This code may not be used with others and will expire at 11:59pm EST on November 30th.
Enter the code at time of checkout to receive the discount. This is the only time of year we introduce any similar discounts. Thank you for your continued support and we look forward to working with you!
So if you are looking for educational material to study over the coming holiday season, this is definitely worth checking.
Yesterday, I tweeted about $AUDUSD ‘s structure prepare. Here is the updated chart. I expected market to fill the single prints between 7074 and 7143.
$AUDUSD looking at the potential of repairing the structure between 7074/7143
— Gavin (@tradergav) Nov. 16 at 11:13 AM
Updated chart
Looking ahead, here are some zones I am watching to do business.
RTH opened with a false break of yesterday’s high (4727.5 vs 4729.5), and auctioned past yesterday’s point of control and to the lower balance zone (HVN). This is contextual review, which is very important practice (at least for myself) to identify trade location. Actually entries relied on the skill of volume and order flow analysis, that’s a whole different story.
NQ Futures broke out from bracket on Monday. It retested the previous daily swing high 4676.5 and rejected at the Monday’s VPOC today gave me a hint that the breakout was for real (at least for day trading purposes), and market was trying to discover higher price levels.
It has been a long time since my last blog post. I have been trading. I thought I will write a quick review of FESX (DJ Euro STOXX 50 futures) since it is one of the product I frequently trade, and observe some interesting development now.
We are in a 7-day bracket (i.e Price rotates up & down without clear directional conviction.), and yesterday (Monday) we had a false break at the bracket low and previous swing low at 3375, and immediately, we saw short covering which brought the market back to bracket high. The day ended with a short covering profile (P-shaped profile).
This is a going to be an eventful week with ECB president speaks, AUD, GBP interest rate decisions and Non Farm Payroll at the end of the week. It will be interesting to see if we can finally breaking from this box.