
Here are the charts for 16 March 2018 with zones of interest marked. Markets covered: 30yr US Treasury Bonds – ZB June 18 Contract 10yr US Treasury Notes – ZN June 18 Contract 5yr US Treasury Note – ZF June 18 Contract Basic Principle = Trade Location + Order Flow
EOD Recap 15 March 2018
Refer to pre market prep post here. Here are the EOD reviewed Charts. Markets covered: 30yr US Treasury Bonds – ZB June 18 Contract 10yr US Treasury Notes – ZN June 18 Contract 5yr US Treasury Note – ZF June 18 Contract The basic principle is Trade Location (zone) + Order flow analysis (Entry, Exit […]
Market Prep 15 Mar 2018 zone of interest
Here are the charts for 15 March 2018 with zones of interest marked. Markets covered: 30yr US Treasury Bonds – ZB June 18 Contract 10yr US Treasury Notes – ZN June 18 Contract 5yr US Treasury Note – ZF June 18 Contract Basic Principle = Trade Location + Order Flow
EOD Recap 14 March 2018

Refer to pre market prep post here. Here are the EOD reviewed Charts. Markets covered: 30yr US Treasury Bonds – ZB June 18 Contract 10yr US Treasury Notes – ZN June 18 Contract 5yr US Treasury Note – ZF June 18 Contract The basic principle is Trade Location (zone) + Order flow analysis (Entry, Exit […]
Market Prep 14 Mar 2018 zone of interest
Here are the charts for 14 March 2018 with zones of interest marked. Markets covered: 30yr US Treasury Bonds – ZB June 18 Contract 10yr US Treasury Notes – ZN June 18 Contract 5yr US Treasury Note – ZF June 18 Contract Basic Principle = Trade Location + Order Flow
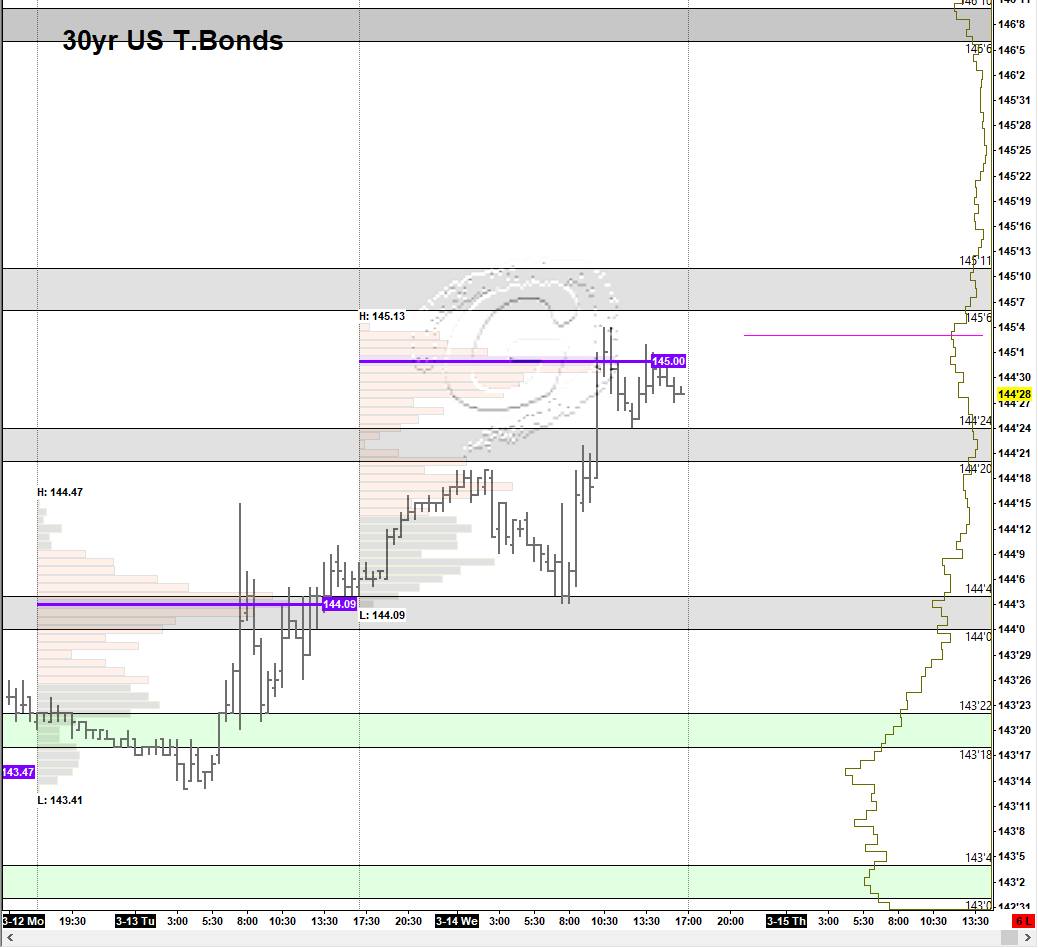
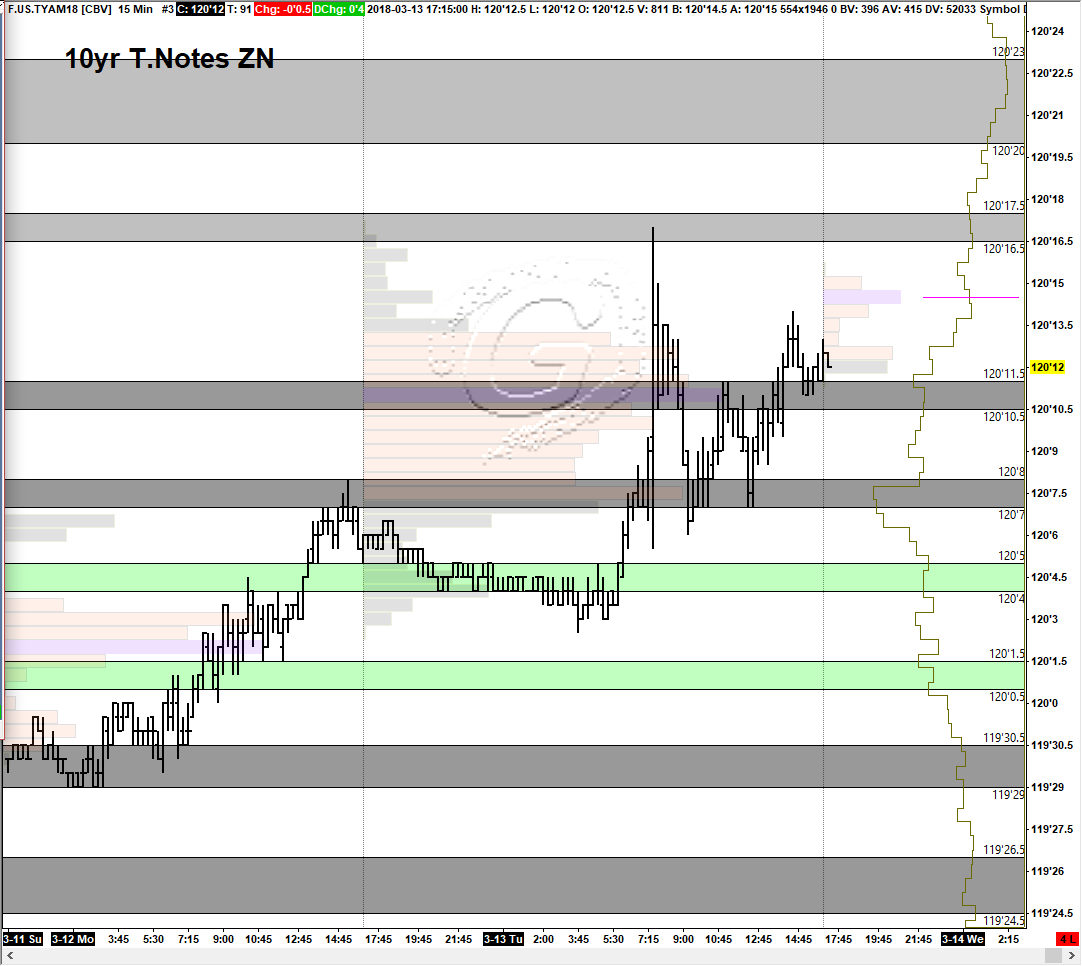
EOD Recap 13 March 2018
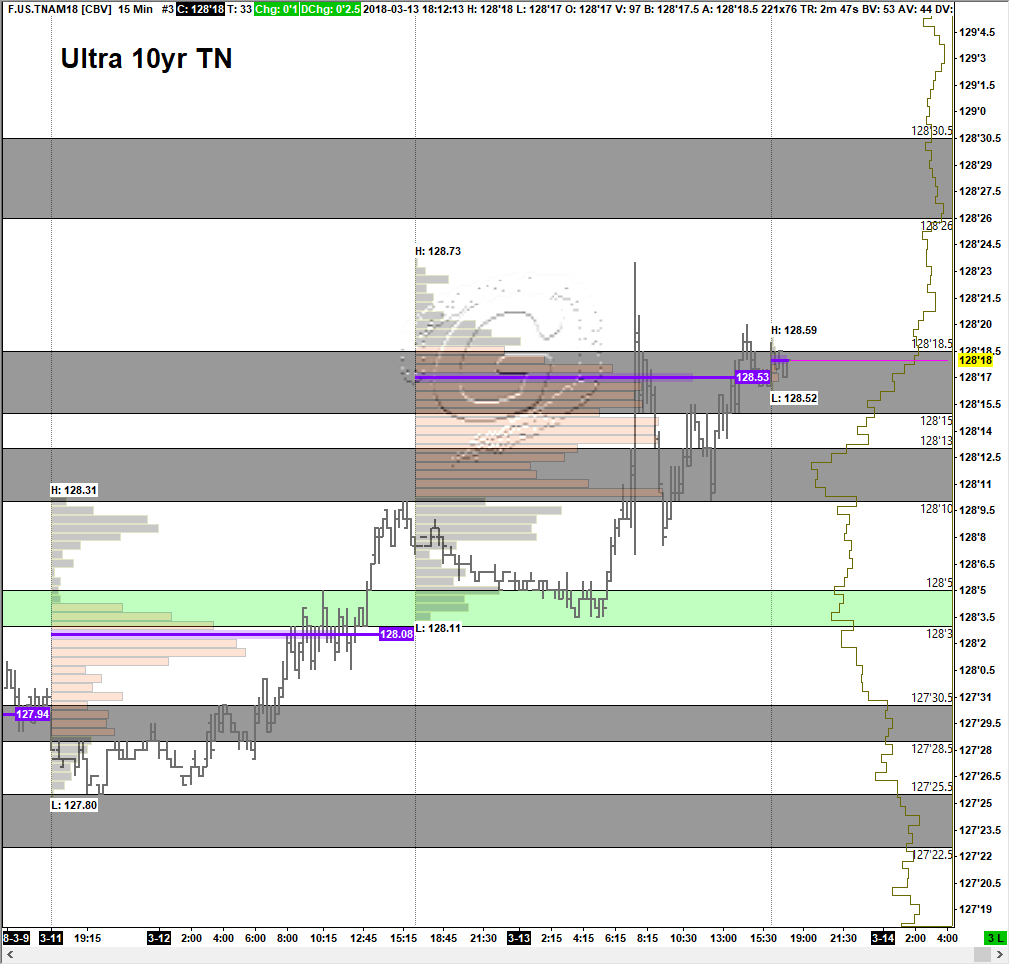
Refer to pre market prep post here. Here are the EOD reviewed Charts. Markets covered: 30yr US Treasury Bonds – ZB June 18 Contract 10yr US Treasury Notes – ZN June 18 Contract Ultra 10yr Treasury Note – TN June 18 Contract The basic principle is Trade Location (zone) + Order flow analysis (Entry, Exit […]

