I always try to achieve minimalism in my trading. Keeping my trading chart as clean as possible is essential. There are few reference levels that are always on my chart.
The 5 references I use and shown on my chart are:
- Previous Day’s High and Low
- Custom Time Range (It could be the opening range of any market session, etc)
- Highs and Lows of the custom time range, and the extensions
- ATR Projections
- Market sessions (Tokyo, London, and New York)
There are many ways to use these levels to trade. I am not discussing them in this blog post. My purpose in writing this blog post is to share my TradingView indicator. Hopefully, it will help to make your trading life a little easier.
What is TradingView
Tradingview is my go-to and charting platform for Forex and Cryptocurrencies trading. It is highly customizable, portable, and affordable. It offers both free and premium subscriptions.
You can find out details of TradingView’s features here. I highly recommend the platform.
Try Tradingview Pro Charting Platform For 30 days
Tradingview is my go-to FX charting and trading solution. I have done extensive coding and trading on the platform. I am happy to recommend them.
If you are interested in using Tradingview, you can try out the Pro membership FREE for 30 days. This is an excellent time to check out the powerful features of Tradingview charting.
Free TradingView Indicator – Simple Charting Toolbox
My goal is to have all the essential tools in a toolbox. I have spent some time coding them into one indicator.
In case you want to skip the description and use the indicator right away, here is the indicator page.
In this indicator, MotherBoard v1, you can:
- Highlight Custom Time Range
- Plot High and Low of the Custom Time Range
- Plot ATR Projections
- Plot previous day’s High and Low
- Highlight Market Sessions
Here are the descriptions of each tool and how to use them:
Highlight Custom Time Range
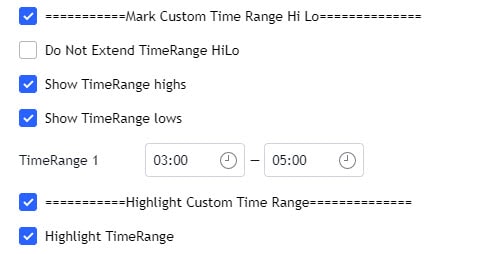
This tool allows you to highlight any time range of your choice with a transparent background.
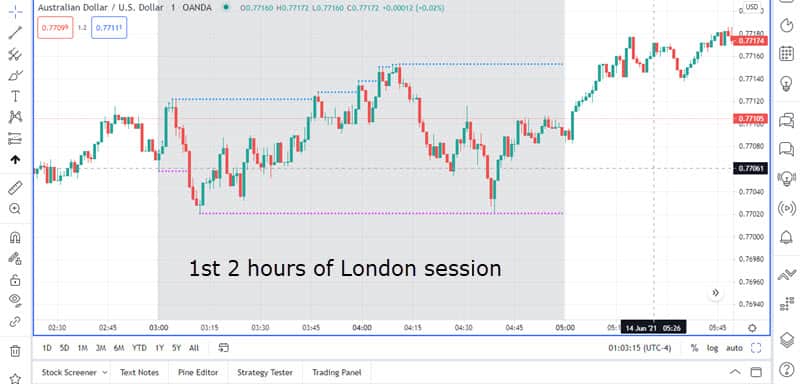
The time is based on the exchange time of your Datafeed/broker. In my case, I am using Forex data from Oanda. It is using New York time.
In the example below, I am highlighting the first 2 hours of the London session open. (GMT-4, 0300-0500).
(note: this is just a demonstration of the tool, not a trade setup)
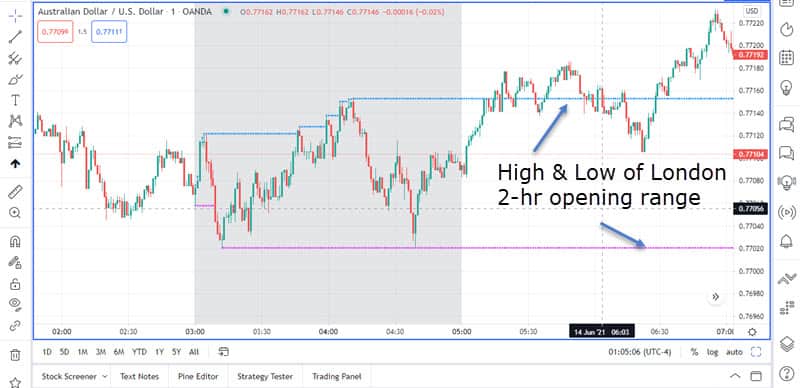
Plot High and Low of the Custom Time Range
Part of the Custom Time Range tool is the ability to extend the high and low of the range for the rest of the trading day.
The high and low extensions can be disabled by checking the “Do Not Extend TimeRange Hi-Lo” option.
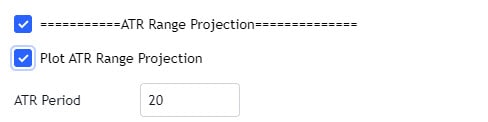
Plot ATR Projections
The third tool in the MotherBoard indicator is ATR projections.
This is a simple indicator that draws the projected Day ATR High and Day ATR Low based on the previous day’s ATR and current high and Low.
ATR refers to Average True Range. You can find out more about ATR here.
The name of the levels might sound weird, or you can call anything you want to. The logic behind it is simple. It uses daily ATR calculation to project the current day’s extremes.
The construction of the indicator:
- Daily ATR= 20-day ATR up to yesterday’s close
- Projected Day High = Current Day’s Low + Daily ATR
- Projected Day Low = Current Day’s High – Daily ATR

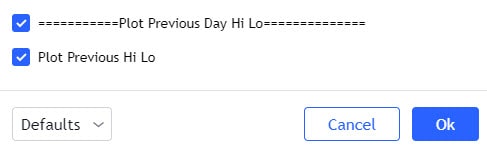
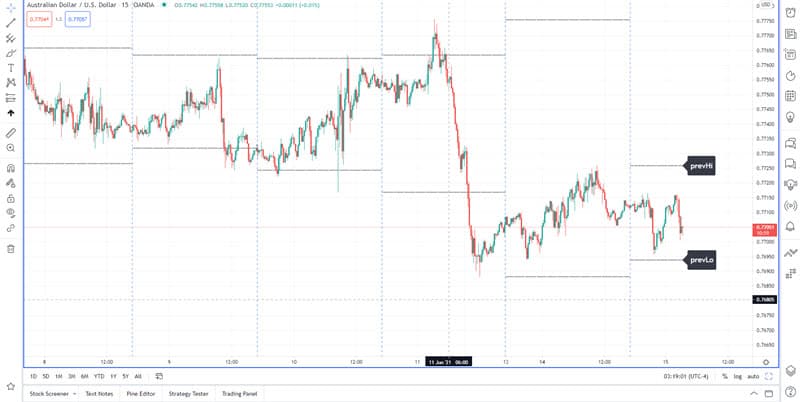
Plot previous day’s High and Low
The third indicator in the MotherBoard v1 is Previous Day’s High/Low.
The indicator plots the High and Low of the previous trading day. It uses the exchange time of your broker.
In my case, with the Oanda data feed, the indicator takes the high and low from UTC-4 1701-1700.
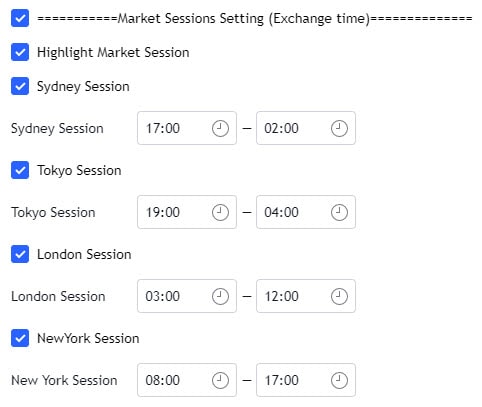
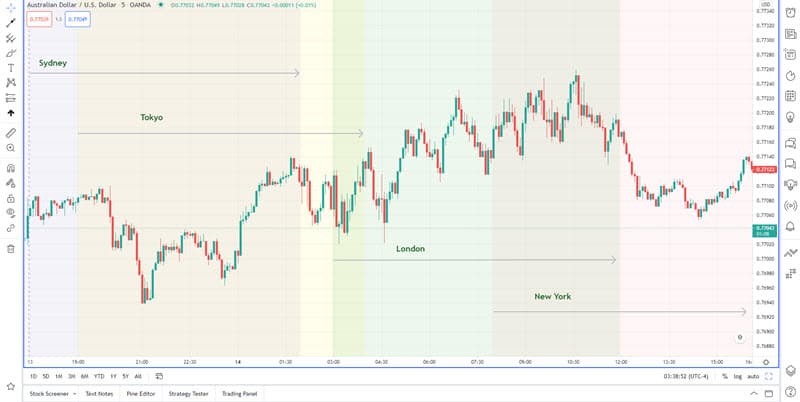
Market sessions (Tokyo, London, and New York)
The last indicator of the toolbox is the Market Session Highlight. The indicator highlights the market sessions with transparent backgrounds.
The last indicator of the toolbox is the Market Session Highlight. The indicator highlights the market sessions with transparent backgrounds.
The indicator uses the exchange time of your chart data and it allows you to customize session start and end time.
Free TradingView Indicator: MotherBoard v1 – A Wrap-up
There is no magic indicator here. I consolidated my codes into one toolbox for housekeeping purposes. This is what I use in my trading, hopefully, it helps some of my 13 readers.
The indicator is completely free to use and share. You can find the indicator here.
Enjoy, Stay Safe, and Good Trading.
Want more Free Tradingview Indicators?
I like to share my Tradingview indicators with traders. You can check out the links below for more free indicators:
If you are new to trading, make sure to check out my Back To Basics of Trading series.
If you like what I do on this site, you can buy me a coffee (absolutely no obligation!)


Trading view is charting toolbox is very useful to the traders. This really inspires trader to perform trading worldwide.