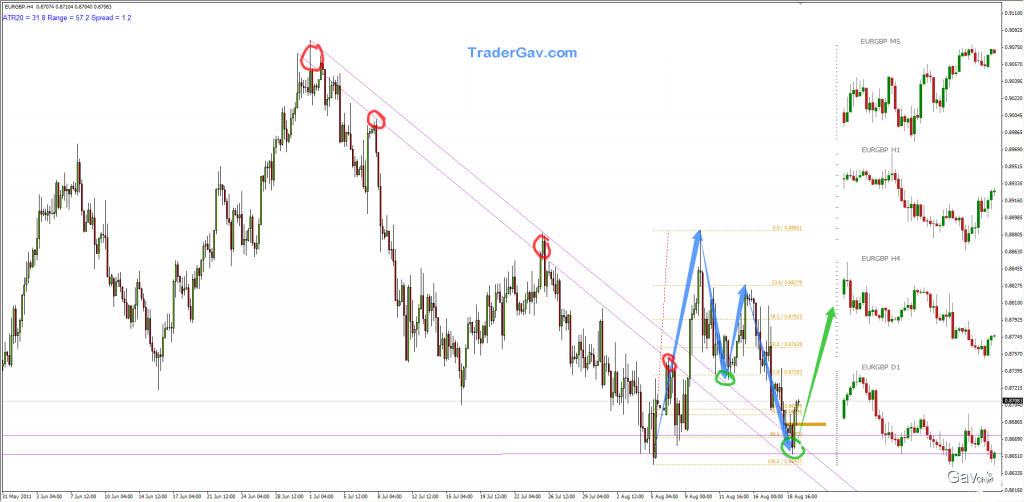
EURGBP pulls back to the previously broken down trend line, and also complete a bullish harmonic formation. This presents a potential long opportunity with first target around 0.8880. Here is the…..CHART!
Bullish Bat
$EURCHF 10 May 2011

EURCHF back to the bottom of the trading range, and is also testing support level in daily chart. I see a opportunity to play at the Long side with potential target at 1.28. Here is the … CHART!
Spot Silver $XAGUSD 04 May 2011

Here is the spot silver setup that I am looking at. I was looking at 40.85 as potential support level, and here we are. Let’s see if we have a bounce from here. Here is the …. CHART! click to view full chart
$GBPUSD 18 April 2011

I tweeted earlier about potential long opportunity of cable at 1.6130. This level will see the completion of a bullish harmonic formation, and it is also at the demand level which increase the odds of long position. Here is the …. CHART!
$AUDNZD 15 April 2011

Here is the chart I mentioned in my tweet. We have the completion of bullish harmonic formation, price reaching bottom of the channel and support level. Setup will be invalidated if 1.3180 level is broken. Here is the ….. CHART!
$NZDUSD 15 Feb 2011

NZDUSD is currently trading in an interesting zone. We have a bullish harmonic formation and the confluence of key support levels, and daily rising trend line. If a bounce from here happens, I have two possible scenarios. 1st is a pull back and then continuation of bearish symmetrical movement (Refer to the yellow lines). 2nd […]

