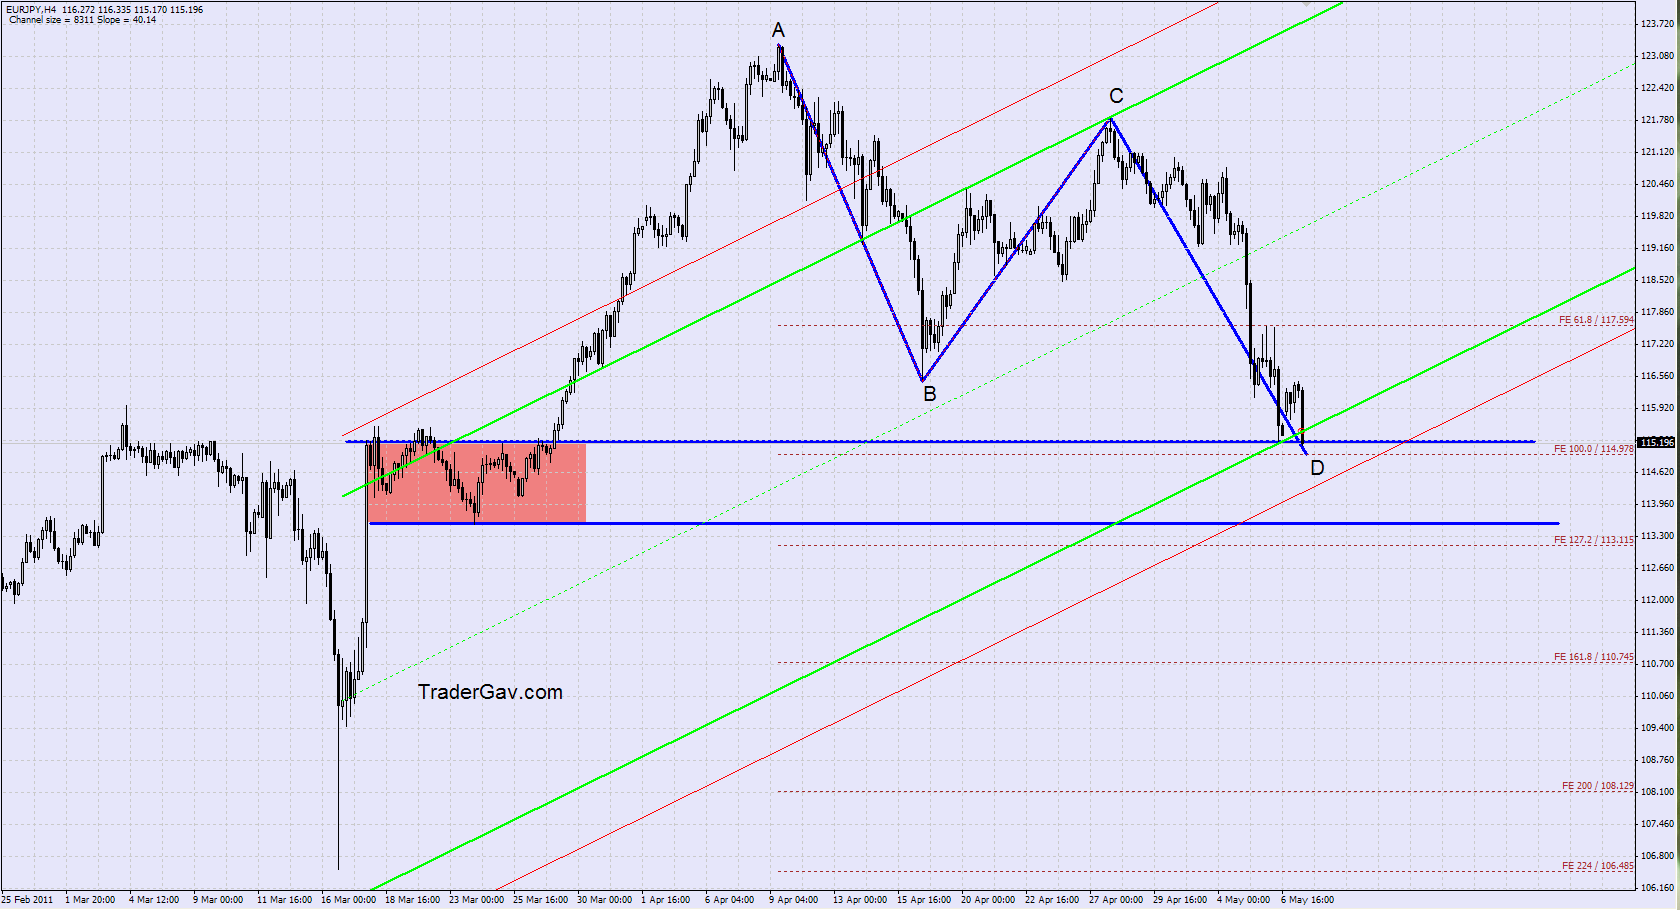
Here is one of the charts in my radar this week, $EURJPY. I have observed the completion of ABCD formation. I am interested in watching the price go a little deeper into support zone, and looking for opportunity to establish Long position. Let’s see. Here is the CHART!
ABCD
Spot Silver $XAGUSD 04 May 2011

Here is the spot silver setup that I am looking at. I was looking at 40.85 as potential support level, and here we are. Let’s see if we have a bounce from here. Here is the …. CHART! click to view full chart
$EURJPY 02 May 2011

Here is the potential long setup I tweeted earlier on. We have a pretty neat symmetrical movement within the channel. And I am still looking at 123 as potential target. Here is the… CHART!
$EURGBP 13 April 2011

Here is the EURGBP chart I mentioned earlier on in my tweet. The pair has recently completed a Bearish ABCD formation, and it is trading right in the supply level. I am looking at the short side for now, and the setup will be invalidated above 0.8945. Here is the…. CHART!
$NZDUSD 15 Feb 2011

NZDUSD is currently trading in an interesting zone. We have a bullish harmonic formation and the confluence of key support levels, and daily rising trend line. If a bounce from here happens, I have two possible scenarios. 1st is a pull back and then continuation of bearish symmetrical movement (Refer to the yellow lines). 2nd […]
$USDJPY 01 Feb 2011
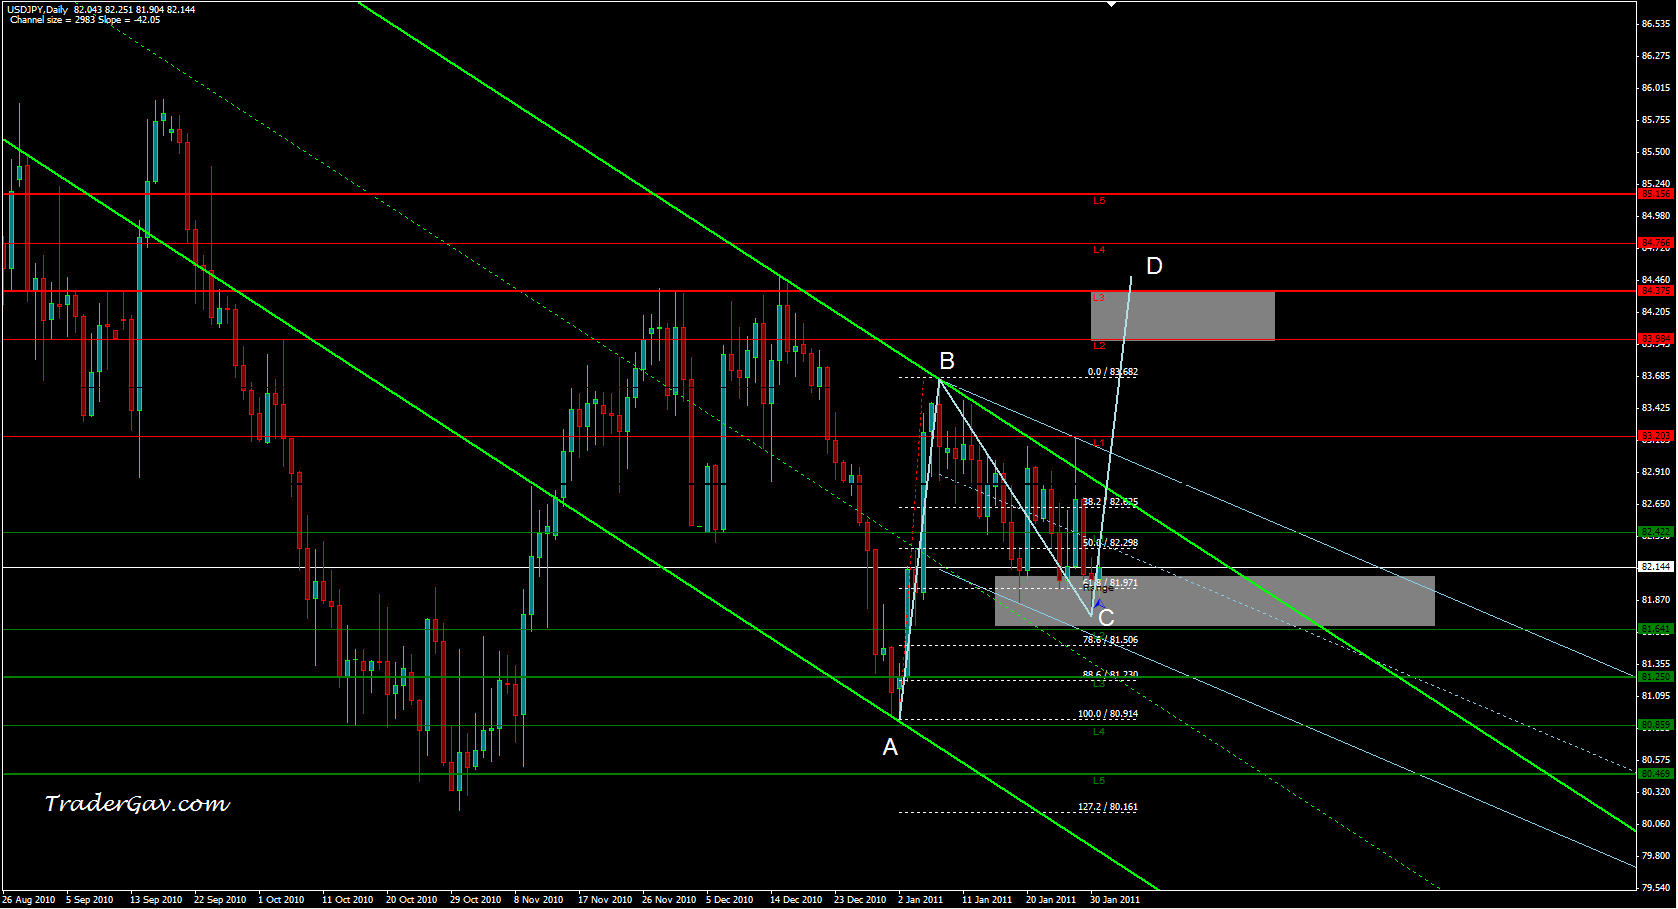
This is one of the swing trades that I am working on. USDJPY is back to 82 zone, in which I see some decent supports in this area. And with the 61.8% retracement from the last swing leg, I am looking at the potential completion of ABCD formation around/above 84 levels. Well, I might be […]

