Sierra Chart Book sharing: Market Depth Historical Graph
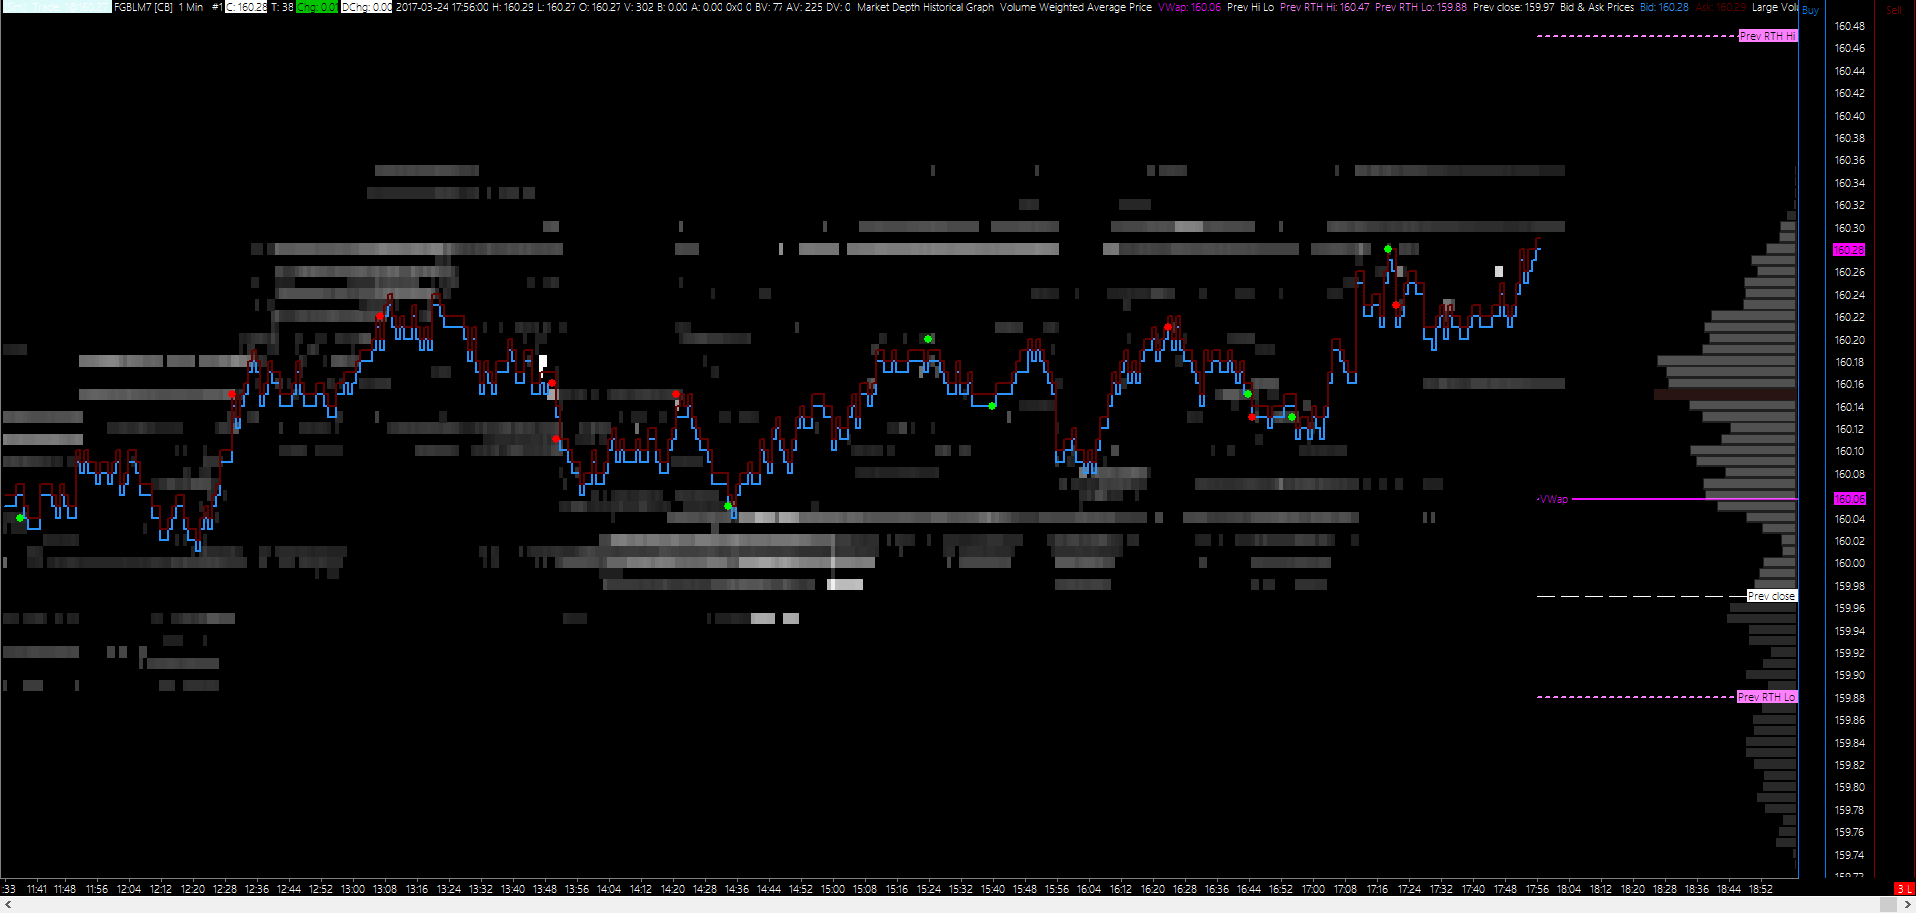
Sierra Chart introduced Market Depth Historical Graph at the end of 2016 after receiving requests from users. It is a tool which is similar to BookMap. The Market Depth Historical Graph study displays at each chart column the highest market depth quantity at each price level, which occurred during the timeframe of the chart bar, as a color-coded rectangle.
Here is the chartbook I use for my trading. In order to use Market Depth Historical Graph, "Record Market Depth Data" has to be activated as follow:
Please feel free to download, customize and share.
- Select Global Settings >> Symbol Settings on the menu.
- Locate the symbol or symbol pattern for the Symbol in the list of symbols, that you want to use the Market Depth Historical Graph study with.
- Select the Intraday tab.
- Enable the Record Market Depth Data option.
- Press OK.
- Reconnect to the data feed with File >> Disconnect and File >> Connect to Data Feed after altering the Symbol Settings.
Market Depth Historical Graph Chart Book
Tips (no obligation!)


Comments
Historical comments are preserved here. New comments are closed.