Just a quick post of one of the trades I made yesterday. I thought it might provide some educational value to my now 13 readers.
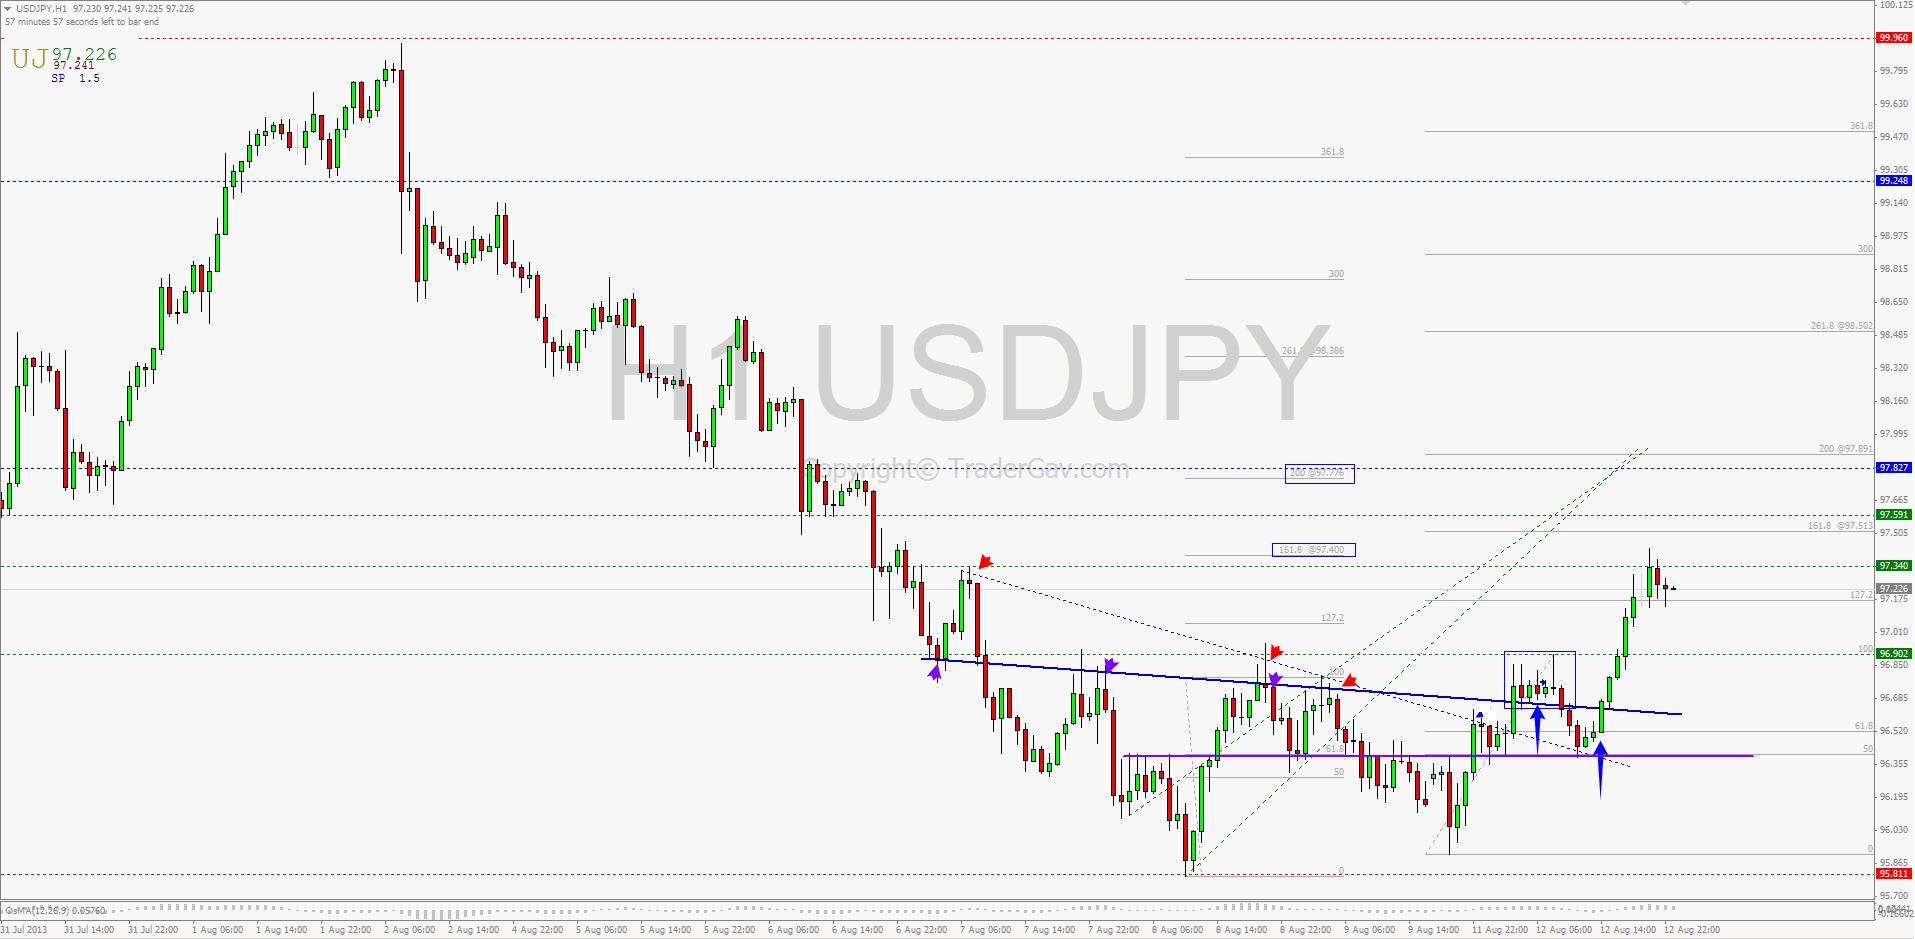
I went long of USDJPY around mid London session yesterday. My entry was not the best I would like to have. I saw a small consolidation cluster around 96.75 , and it, in fact, broke the inner trend line. (Refer to the blue bold line in the chart below). My view was, the consolidation above inner trend line might potentially be a launch pad for a upward movement. Well, it dipped a couples of hours later, but never go beyond 50% retracement of the current swing. Stop loss was not triggered.
In retrospect, the dipped after my entry was indeed a retest of another broken down trend line and support level. In hindsight, this is a better entry, but hey,that’s trading, and everything looks better in hindsight, no?
Target is set at 97.40. This is the price projection measured by using the Fibonacci extension of 161.8, golden ratio, of the lowest swing low to the break of inner trend line. The target was achieved during Tuesday Asian morning session.
2nd target is set at measured move up to around 97.80 which is also a resistance level.
Here is the 1-hour chart of USDJPY.
I suggest to have a look at Steve’s NBT posts for the concepts of price projections for target setting.
That’s it for now. Have a good trading week ahead!
From the desk of TraderGav.com


Leave a Reply