• Skip to primary navigation
  • Skip to main content
  • Skip to primary sidebar
  • Skip to footer

TraderGav.com

Gav's trading blog - Perseverance, Consistency, Confidence

  • Home
  • Start Here
    • Back to Basics of Trading
    • Resource For Traders – The Best Tools for Traders
    • Learn Trading Articles
    • Sierra Chart Resource
  • Blog
    • Blog Posts
    • Other learning resource
    • Dummy Collection
    • Harmonic setups
  • About Me

Market recap 18-Jul-2006

by Gav Leave a Comment

STI closed higher? Ok, it did. It closed higher than yesterday. Good news, it is still below 12-day, 50-day and 200-day EMA. I see some space to move towards recent low, which is 2277 aread.
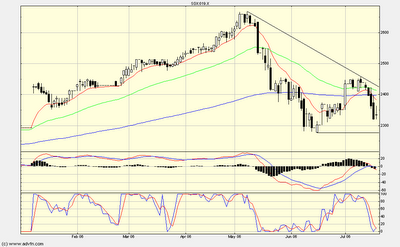
Nothing much about UOB Sesdaq. Still ding-dong between 50-day and 200-day moving averages. Just be patient to watch for development during this result relaesing season. Recent low is around 90 area. I am interested in looking at Short side if the support area is broken.

Filed Under: Old blog archive

Reader Interactions

Comments

  1. TopTrader says

    at 10:45 pm

    UOB Sesdaq – Noted that MACD signal is accurate every time in your chart, ie, cut up, buy, correct; Cut down, sell, correct. This time, it may be better to wait for macd cut up before buying.

    Reply
  2. TopTrader says

    at 4:45 am

    UOB Sesdaq – Noted that MACD signal is accurate every time in your chart, ie, cut up, buy, correct; Cut down, sell, correct. This time, it may be better to wait for macd cut up before buying.

    Reply

Leave a Reply Cancel reply

Your email address will not be published. Required fields are marked *

Primary Sidebar

Best Tools For Traders

Recommend FX Charting

Footer

Recommended FX Charting

Recommended Training

FXSAnalytics
Price Action Course for Professionals

Copyright © 2025 · Affiliate Disclosure · Privacy

We use cookies to ensure that we give you the best experience on our website. If you continue to use this site we will assume that you are happy with it.Ok