• Skip to primary navigation
  • Skip to main content
  • Skip to primary sidebar
  • Skip to footer

TraderGav.com

Gav's trading blog - Perseverance, Consistency, Confidence

  • Home
  • Start Here
    • Back to Basics of Trading
    • Resource For Traders – The Best Tools for Traders
    • Learn Trading Articles
    • Sierra Chart Resource
  • Blog
    • Blog Posts
    • Other learning resource
    • Dummy Collection
    • Harmonic setups
  • About Me

Old blog archive

Paper Trade Series: Mini Dow 22-June-2006

by Gav Leave a Comment

I am looking at Short position of Mini Dow at 11,112. A established downtrend is shown in 10-min chart.

Filed Under: Old blog archive

Paper Trade Series: Mini Dow 21-June-2006

by Gav Leave a Comment

It is a excited opening for U.S market. From 1 min chart of Mini Dow,there was a good setup for Long position. Mini Dow futures was trading above 10, 15, and 30 period moving averages and closed above CBL entry level. RSI supported the entry decision by making higher lows. Entry was at 11075 with exit at trailing stop 11114.

Filed Under: Old blog archive

Paper Trade Series: Mini Dow

by Gav Leave a Comment

15-min Mini Dow

Finally , i got my new charting service up and running. I have been watching Mini Dow for opportunity. I have decided to perform paper trading for few days in order to get use of this new chart service.

First entry is when Mini Dow broke recent downtrend and RSI making is positive divergence. Entry was triggered at 11022 and exit was set at 11041 which is previous high. Target hit. Gain +19 ticks.
Second entry was set at 11054 when higher low in RSI is formed and Mini Dow broke count back entry . Signs of strength. Exit was set at 11090, previous high, resistance area. Target hit. Gain +36 ticks.

Bigger profit was missed, however, the objective is to capture the strong move and exit at the known resistance level to protect profit.

Filed Under: Old blog archive

Charting Headache Continues: No trade today

by Gav Leave a Comment

It is going to take sometime for my new chart service to be activated. Maybe it is time for me to take break after some winning trades for the past 2 weeks. I can't risk by doing day trading with delayed chart.
I 'll be back when the chart is available to me again.

Be a better trader today.

Filed Under: Old blog archive

Charting headache: No trade today

by Gav Leave a Comment

I do not believe it. My broker just replaced their charting service which delays 2 bars. This has a big implication to my day trading strategy. I can't make a timely decision based on the delay chart. I have decided not to trade today in order to sort out the charting problem. This is a bad headache to me.
Anyway, SIMSCI is likely to be moving sideway if not profit taking after strong gain from last Friday. This can be observed first from Nikkei this morning.

Filed Under: Old blog archive

Chart Eye: SIMSCI Futures : ended 16-June-2006

by Gav Leave a Comment

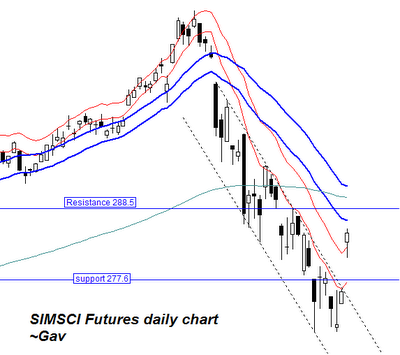
This is daily chart of SIMSCI futures. It broke out from existing downtrend channel last Friday after a strong day. It is currently facing resistance soon.
Directional index has started ticking up after reaching oversold level. And trend index shows a same picture as well. Sentiment is improving though it is still remain negative.
It is likely to see rebound rally, though downtrend is still intact.

Filed Under: Old blog archive

  • « Go to Previous Page
  • Page 1
  • Interim pages omitted …
  • Page 6
  • Page 7
  • Page 8
  • Page 9
  • Page 10
  • Interim pages omitted …
  • Page 14
  • Go to Next Page »

Primary Sidebar

Best Tools For Traders

Recommend FX Charting

Footer

Recommended FX Charting

Recommended Training

FXSAnalytics
Price Action Course for Professionals

Copyright © 2025 · Affiliate Disclosure · Privacy

We use cookies to ensure that we give you the best experience on our website. If you continue to use this site we will assume that you are happy with it.Ok