• Skip to primary navigation
  • Skip to main content
  • Skip to primary sidebar
  • Skip to footer

TraderGav.com

Gav's trading blog - Perseverance, Consistency, Confidence

  • Home
  • Start Here
    • Back to Basics of Trading
    • Resource For Traders – The Best Tools for Traders
    • Learn Trading Articles
    • Sierra Chart Resource
  • Blog
    • Blog Posts
    • Other learning resource
    • Dummy Collection
    • Harmonic setups
  • About Me

Trading Journal

Dummy day trading #60 12-Mar-2007: NQ Short trade closed

by Gav Leave a Comment

I made an attempt to short NQ futures when a new downtrend cycle was formed. And I got stopped out by this choppy day. Trailing stopped was triggered with -0.89 R loss. Tough.

[photopress:NQ200ticks12Mar2007.jpg,full,alignleft]

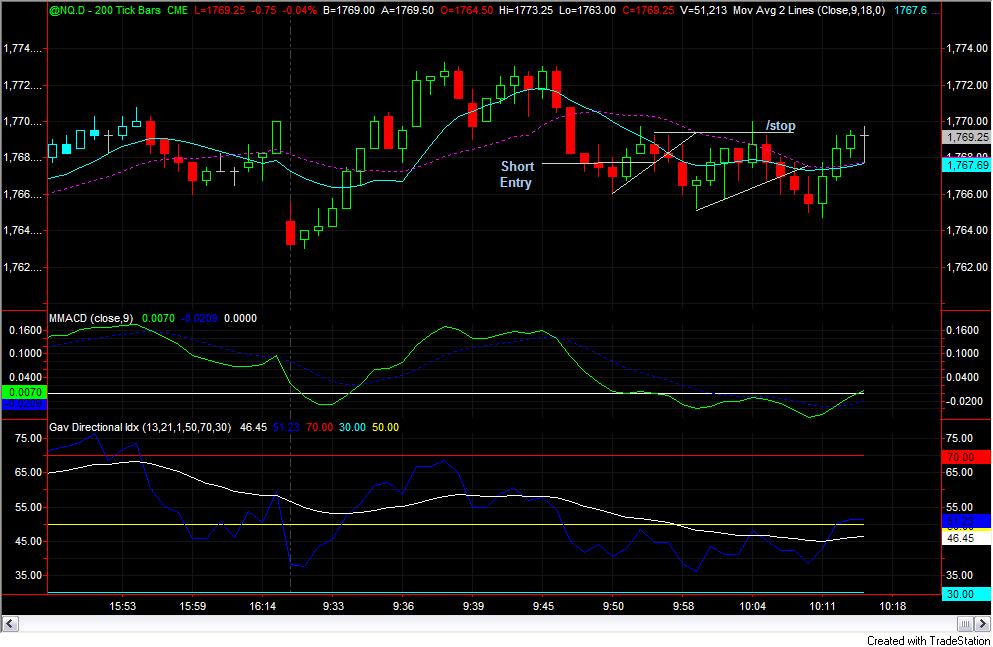
Journal note: This is a bad entry. Trying to dummy trade when everything was still in the range.  Dumb trade.

Filed Under: Dummy Collection, Trading Journal Tagged With: Dummy Trading E-mini Nasdaq, Trading Journal

Just some quick updates

by Gav Leave a Comment

Again, I am facing the same ‘problem’. I have not been trading since starting of March. With my current style of trading which is very much trend-following stuffs, so, I simply did not have any setup to get in. I am not so concerned about this “problem”, basically, I am just not trading, and the most importantly, not losing.

I have a couple of options. First is to expand my trading basket to commodities. Less dependent on equity only. This ain’t easy though, I am still studying to see if my system works. On the other hand, I am working on a new system on ER2, in which I intend to make it a “bread and butter” or “Pay-the-bill” type of system.

Let’s see if I can make some trades next week.

One side note, I guess, I am getting popular. Why? After getting increasing number of spams comment, now I start receiving negative comments. Holy cows. Anyway, I have deleted them, and I ain’t going to entertain these losers.

Filed Under: Trading Journal Tagged With: blogging

Hands Free

by Gav Leave a Comment

I have not made a single trade since starting of March. Missed one entry yesterday, can’t find one today. Futures opened with gap and stays flat. I will spend the day reading instead.

Andy Swan wrote a simple but powerful post Think Big-> Do Big , at his blog. check it out.

Filed Under: Trading Journal Tagged With: Trading Journal

Trend table 05-Mar-2007

by Gav Leave a Comment

Well, everything is still down. There is no change of trend table. [Read more…] about Trend table 05-Mar-2007

Filed Under: Trading Journal Tagged With: Trading Journal

Structure your Entry, a suggestion

by Gav 10 Comments

Years ago, when I was reading Alexander Elder’s Trading for a Living: Psychology, Trading Tactics, Money Management, the triple screen idea caught my attention. I thought it was a great idea for my swing trading. The basic idea is to have a broader view of your trading time frame, looking at the bigger picture before considering your entry.

Since the beginning of this year, OK my dummy trading 2.0, I have been using this concept. I always have 3 screens on my chart, for example, NQ futures. I called these three screens Sentiment screen (the longest time frame), Value screen (intermediate time frame), and Entry screen (the shortest time frame). Again, I am not illustrating my trading setup, because, it is irrelevant to anybody. Instead, I will give a brief explanation of this structure setup.

Sentiment Screen
This is a screen with the longest time frame among the three. In this screen, you need to have your own method, be it a moving average or your very own Magic Index to determine the direction of the trend and current sentiment of the market that you are trading. For example, if we have a very bullish view in Sentiment Screen, we do not want to go short. It is either Long or no trade.

You should spend some time to find the right method for yourself to determine bullish/bearish sentiment and determine a trend. No free lunch, do your own research.

Value Screen
This screen is having a shorter time frame than the Sentiment Screen. How short is shorter? Up to you. Do your research. It can be 3x shorter or even 5 times shorter. No absolute answer. Here, I am looking for the best value to enter a position. For example, you might be looking for price to trade near a support level, moving average or Bollinger band, etc. For example, if you are trading breakout, then you might want to see congestion on this screen. If you are considering joining a trend, you might want to wait for a bounce from a pullback on this screen.
On this screen, we decide if it worth establishing a position. I don’t want to see price exhaustion on this screen.

This screen keeps me disciplined from chasing a trade. When the price runs away on this screen, I do not want to establish a position.

Entry Screen
This is the shortest time frame. In this screen, I am looking for an entry spot, be it a dummy spot or chart patterns, etc. The most important thing to remember here is, I am only interested in an entry spot in the direction of the Sentiment screen.

Of course, this is not all. This structure setup only helps in refining the entry signal. There are different ways to incorporate stop loss. The stop may be set up according to the chart in Value screen or Entry Screen. Again, this is subject to your own research.

Stephane from The Chart Strategiest applies the similar approach that I have described here, though there are differences. Check out his blog. He trades both commodity and index futures. It is good to see how he trades.

Just another piece of study that I have done to improve my trading.

Filed Under: blogs, Learn Trading, Trading Journal Tagged With: Strategy & tools

Sudden and unexpected?

by Gav Leave a Comment

I am not trying to be an expert to give market commentary. Just some observations during my weekend studies. If NYSE TICK was telling me something, here it is.
Ok , hindsight. We had a divergence between NYSE TICK and S&P at 22-Nov-2006 when S&P was making a new high and TICK data did not agree with that. We subsequently had a pull back.And, again, 22-Feb-2007, S&P tried a new high, and this time we had a massive divergence with NYSE TICK again. And the following was just history.

[photopress:SP_Adj_tick02Mar2007III.jpg,full,center]

I have read a couple of reports, most described the sell down as “Sudden”, or “Unexpected”. Uhm.. maybe it is really not so “unexpected”. I don’t know.

I am studying some put call ratio stuffs now. Let’s see if I can find some interesting points. Later.

Filed Under: Trading Journal

  • « Go to Previous Page
  • Page 1
  • Interim pages omitted …
  • Page 89
  • Page 90
  • Page 91
  • Page 92
  • Page 93
  • Interim pages omitted …
  • Page 124
  • Go to Next Page »

Primary Sidebar

Best Tools For Traders

Recommend FX Charting

Footer

Recommended FX Charting

Recommended Training

FXSAnalytics
Price Action Course for Professionals

Copyright © 2025 · Affiliate Disclosure · Privacy

We use cookies to ensure that we give you the best experience on our website. If you continue to use this site we will assume that you are happy with it.Ok