• Skip to primary navigation
  • Skip to main content
  • Skip to primary sidebar
  • Skip to footer

TraderGav.com

Gav's trading blog - Perseverance, Consistency, Confidence

  • Home
  • Start Here
    • Back to Basics of Trading
    • Resource For Traders – The Best Tools for Traders
    • Learn Trading Articles
    • Sierra Chart Resource
  • Blog
    • Blog Posts
    • Other learning resource
    • Dummy Collection
    • Harmonic setups
  • About Me

Trading Journal

Trades that got away 14-December-2006

by Gav Leave a Comment

Trend chart of ES turned up within the first hour, at the same time, a dummy long signal was formed. Long position was established above the high of 935am candle. First (minimum target, ~1.7R) was set at yesterday’s high at 1430.50.

Both minimum target and Fib extension 100% were achieved. Stop was moved to Fib extension 100% to protect profit and let the profit run. After ES made a lower high, position was closed at Fib extension 161.8%.

* Fib extension was calculated using yesterday’s low and today opening range high.

Here is the 5-min chart of ES (E-mini S&P futures)

[photopress:ES5min.jpg,full,pp_image]

Filed Under: Trading Journal

Reading: Trading with Candlesticks

by Gav Leave a Comment

As usual, I have done some search work on the net. Here are some nice articles on candlesticks.

  • Candlestick Reversal Bottoms as a Trading Tool
  • Gaps in Japanese Candlestick charts — Technical Analysis Education
  • Trading the Long Red Japanese Candlestick Formation
  • Trading the Long Green Japanese Candlestick Formation
  • Candlesticks and Resistance
  • CBOT – High Probability Trading with Candlesticks
  • Trading the Indicators
  • Why I Use Japanese Candlesticks: Learn the Basics of Those Funny-Looking Charts
  • Combine Candlesticks Analysis with Western Technicals

Books on Candlesticks Trading

  • Japanese Candlestick Charting – Second Edition
  • Beyond Candlesticks: New Japanese Charting Techniques Revealed (Wiley Finance)
  • Profitable Candlestick Trading: Pinpointing Market Opportunities to Maximize Profits
  • Candlestick Charting Explained

Filed Under: Trading Journal Tagged With: Links, Strategy & tools

Trades that got away 12-December-2006

by Gav Leave a Comment

While I am still working on back testing program, I will start forward testing , but this time, I am paper trading. Dummy trading involves certain degree of pattern recognition, this forward testing will improve my skill in this area.

ES,trend chart turned down. I was looking for any opportunity to establish short position. Short position was taken below 11:50am (NY time) candle, after dummy system signaled.

I have two exit targets. Yesterday’s low served as minimum target (1.3R), and Fib extension (From yesterday’s high to today opening range’s low) 100% as second target (4.6R). Initial plan, I would let the profit run if it broke yesterday’s low. I would cover the position at yesterday’s low if market reversed.

Second target was hit.

Here is the 5-min chart:

[photopress:ES_short.jpg,full,pp_image]

Another trading opportunity was found in E-mini Nasdaq. position was established below 11:55am (NY time) candle. NQ position was closed at minimum target (4.2-R) at yesterday’s low. It failed to reach Fib extension 100%.

Here is the 5-min chart of NQ

[photopress:NQ_short.jpg,full,pp_image]

Filed Under: Trading Journal

Readings: Market Profile

by Gav Leave a Comment

I am always curious about Market Profile. After reading some traders are day trading with Market Profile, I decided to do some kinda research on this tool.

Here are some articles I have found:

  • Stock Trading with Market Profile
  • Market Profile… NQoos- TradingNaked
  • Market Profile Trading Methods NQoos
  • Market Profile CBOT – Educational Materials
  • Market Profile Trading Techniques- CME presentation
  • Traders Laboratory – Market Profile Trading Concepts
  • TraderFeed: Using Market Delta in Trading

Books:

Steidlmayer on Markets: Trading with Market Profile, 2nd Edition– Steidlmayer

Filed Under: Trading Journal Tagged With: Links, Strategy & tools

Examing the MMA, Indicatorian approach

by Gav 8 Comments

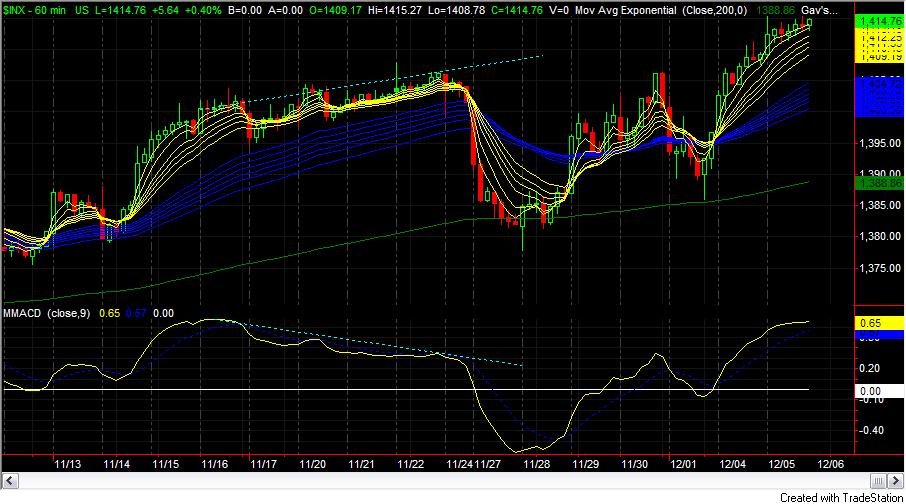
I was thinking if I am going to post this article which I wrote some time back. It makes me sound like a indicatorian (Gavipedia: Indicatorian refers to trader who can’t live without indicator). In fact, I hardly look at indicator. Oh well. This is a season of sharing. I am sharing something that I find to be useful. In case, you are interested in Multiple Moving averages ,as mentioned in my previous post ‘Defining a trend”

I take a deeper look at Multiple Moving averages. Though I don’t like the idea of manipulating price by using indicator, I gave it a try and I think it is useful. The basic idea of Multiple moving average(MMA) is to view the trend as two band of moving averages – short term band and long term band. MMA has provided a great visual of trend, but, how should I quantify it in case I need to integrate into my system?

I obtain an idea from Leon Wilson, Author of “The Next step to share trading success”. (I am not sure if the book is available in U.S, at least, I can’t find it in Amazon.) He is an truly “indicatorian”, and according to the description in the book, he trade stocks for living. He derives something called MMACD (MACD of Multiple Moving averages) Ok, here are the steps I quantify MMA by following his suggestion.

1. Take the combined value of moving averages for each short term band and long term bands. So, now we have two lines instead of two bands of moving averages.

2. We want to measure the distance between short term band and long term band. When the distance goes extreme, you know a bubble is forming and potentially we can expect a pull back. I display MMACD into percentage form.

MMACD=[(short term – Long term)/long term]/100

3. For a better view of the changes, we add in a trigger line. We do not want to establish a Long position when MMACD is below its trigger line. (reverse for short position)
trigger= 9-period Moving average of MMACD

So now we have a new indicator to analyzed Multiple Moving average. An Indicator for an indicator? OMG. Well, It is just some mathematics work to help me in reading Multiple moving average. And personally, I find it to be helpful to analyze trend.

MMACD

I have been using this in swing trading of stocks. And I am looking for the possibility of implementing it in day trading as well. Before you start mesmerizing this MMACD, you gotta understand the concept behind MMA. Check out the links in my previous post “Defining a trend“.

Ok, here is the indicator I have programmed for Tradestation, just in case, some of you are interested in trying out. Pull in GMMA into your chart and MMACD. Observe the behavior. Shoot me some comments if you have other view. Just another tool, dump it if it confused you.

Filed Under: blogs, Learn Trading, Trading Journal Tagged With: Strategy & tools

Work in progress – Dummy 2.0

by Gav Leave a Comment

Maybe you have noticed I am not posting any trade so far. I am not trading this week. After a serious review of my journals, I have realized the weakness of my current trading plan. (Well, basically,strictly speaking, it is not even a plan). I am planning to take the coming 2 to 3 weeks to concentrate on writing out a concrete trading plan. If you have read the Reading Links I have posted, you know it involves a lot of work.(Man, it is not a one-night job). I even pick up backtesting to a certain extent. This is to firm the rules and confidence. My trading plan will be surrounding Dummy trading. So far, the basic belief and findings are, dummy system has great deal of merit.

This should be a project with intense studies and testings. Certainly, I will continue posting materials related to this subject along the way, and of course, some good suggestions from Dave (a.k.a MagicT).

By then, see you at Dummy trading 2.0.

Filed Under: Trading Journal Tagged With: Strategy & tools

  • « Go to Previous Page
  • Page 1
  • Interim pages omitted …
  • Page 100
  • Page 101
  • Page 102
  • Page 103
  • Page 104
  • Interim pages omitted …
  • Page 124
  • Go to Next Page »

Primary Sidebar

Best Tools For Traders

Recommend FX Charting

Footer

Recommended FX Charting

Recommended Training

FXSAnalytics
Price Action Course for Professionals

Copyright © 2025 · Affiliate Disclosure · Privacy

We use cookies to ensure that we give you the best experience on our website. If you continue to use this site we will assume that you are happy with it.Ok